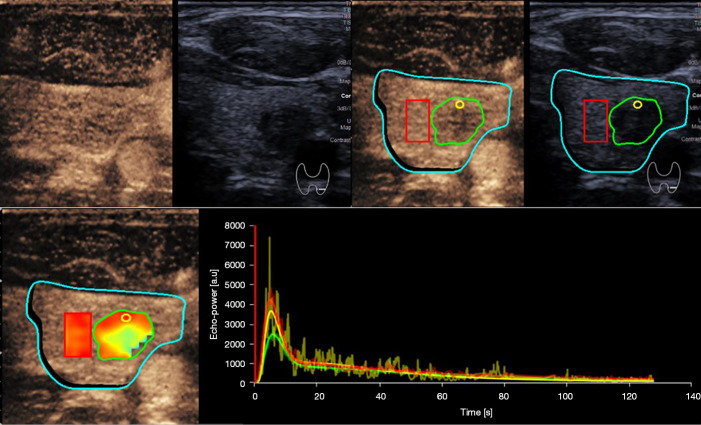
Figure 4.
Example of ultrasound analysis. Delimitation ROI (blue) delineates the processing area, excluding any non-echo data such as text, color bars, or image borders. ROI 1 (green) included the entire tumor boundary on conventional ultrasound with reference to the contrast-enhanced image. ROI 2 (yellow) included 1mm circles that targeted the greatest enhancement point, aided by the color-coded imaging and peak enhancement values generated by VueBox. ROI 3 (red) encircled a large surrounding normal gland including the same image acquisition plane in the same depth and without obvious vessels. The patient was a 36-year-old man with PTMC (1.0 cm diameter) and BRAF mutation. Relative TTP was 1.05, the tumor was well defined, punctate echogenic foci were present, and the tumor was adjacent to the thyroid capsule. These data led to a score of 0.97 in the predictive model. ROI, regions of interest; TTP, time-to-peak; PTMC, papillary thyroid microcarcinoma.

