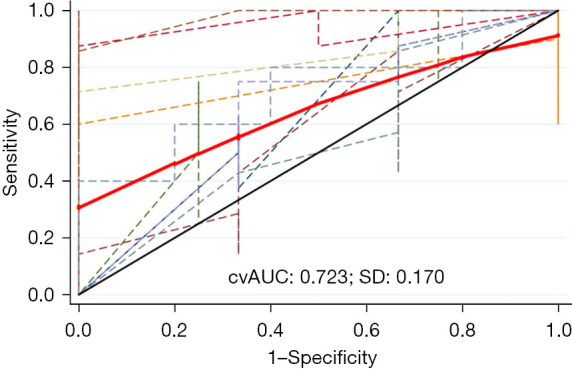
Figure 7.

Ten-fold cross-validation of the model to predict BRAF mutation in patients with PTMC. The dashed lines depict the receiver operating characteristic curves, the solid red line represents the 10-fold mean cvAUC, and the solid black line denotes the reference line for perfect performance. The mean cvAUC was 0.723, with SD =0.170 and 95% CI: 0.591–0.814. cvAUC, cross-validation area under the curve; SD, standard deviation; PTMC, papillary thyroid microcarcinoma; CI, confidence interval.
