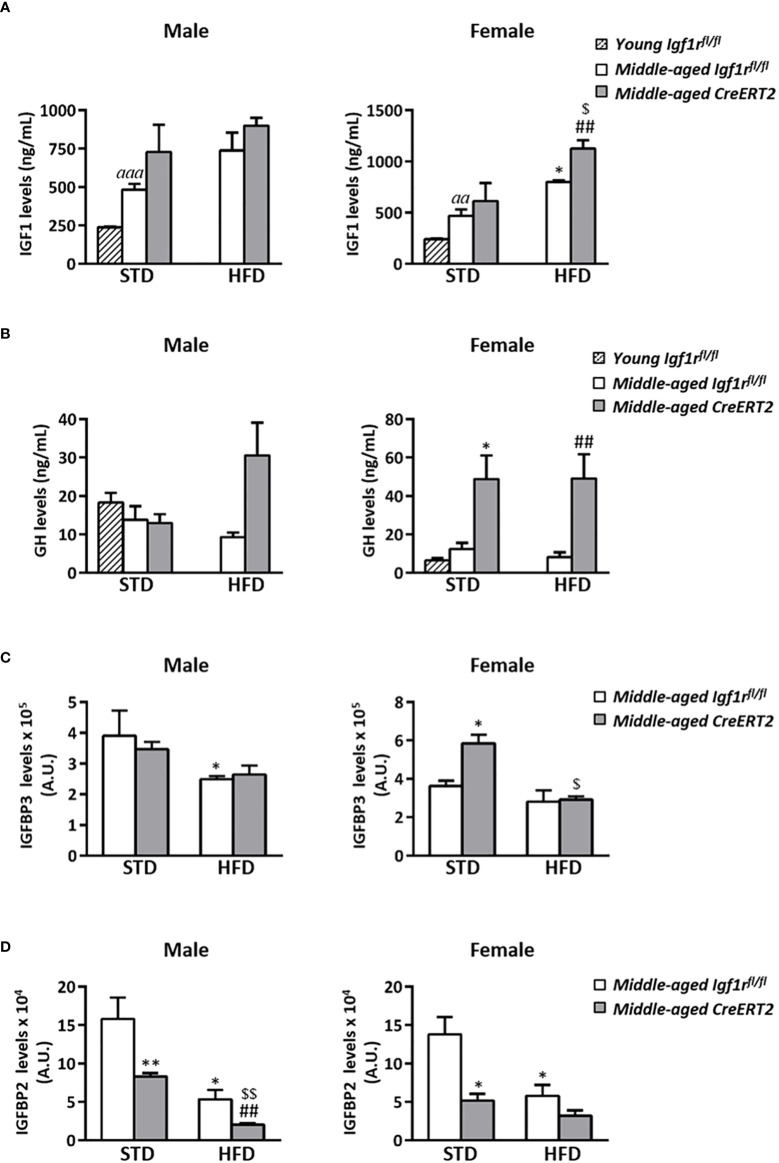
Figure 7.
Impact of IGF1R deficiency on IGF1, GH, IGFBP3 and IGFBP2 serum levels of middle-aged mice. Quantification of circulating levels of IGF1 (A) GH (B) IGBP3 (C) and IGFBP2 (D) in CreERT2 male and female middle-aged mice on STD and HFD compared to Igf1rfl/fl counterparts and to young control (Igf1rfl/fl ) male and females on STD. Data are expressed as mean ± SEM of at least 2 animals per group (n= 2-11 mice per group). aa p < 0.01 and aaap < 0.001 vs. young Igf1rfl/fl mice. *p < 0.05, **p < 0.01 vs. middle-aged Igf1rfl/fl STD animals; ##p < 0.01 vs. middle-aged Igf1rfl/fl HFD mice, and $ p < 0.05, $$ p < 0.01 vs. middle-aged CreERT2 STD animals.

