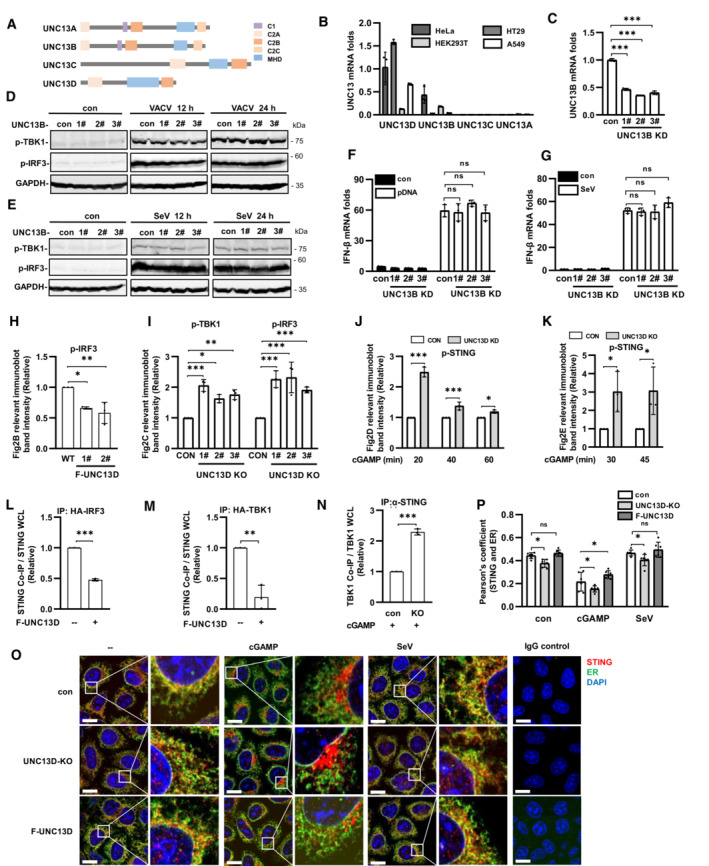
Figure EV2. UNC13B has no effect on interferon‐β induced by viruses, UNC13D inhibits STING signaling.

-
ADiagram of UNC13 family members.
-
BqPCR analysis of UNC13 mRNA levels in wild‐type HeLa, HT29, HEK293T and A549 cells. n = 3 technical replicates.
-
CqPCR analysis of UNC13B mRNA levels in UNC13B stable knockdown (KD) HeLa cells. n = 3 technical replicates.
-
D–GUNC13B stable knockdown (KD) HeLa cells and control HeLa cells were infected with VACV (D) or SeV (E and G), or transfected with plasmid DNA (F) (1 μg/ml), for 12 h or for the indicated time. Protein levels were detected by immunoblotting with anti‐p‐TBK1, ‐p‐IRF3 or ‐GAPDH antibody (D and E). IFN‐β mRNA levels were measured by qPCR (F and G). n = 3 technical replicates.
-
H–NQuantification of the relative expression of relevant proteins in Fig 2B–H. n = 3 biological replicates.
-
O, PUNC13D knockout (KO) HeLa cells and HeLa cells stably expressing FLAG‐tagged UNC13D (F‐UNC13D) and control HeLa cells were treated with cGAMP (100 nM) for 45 min or SeV for 12 h. Confocal microscopy was used to determine the localization of endogenous STING (red), ER marker Calnexin (green) and nuclei (blue) (O). Scale bars: 15 μm. The colocalization of STING and calnexin was analyzed using ImageJ (P). n = 6 biological replicates.
Data information: Statistically significant differences were determined using Student's t‐test (L–N) or ANOVA (C, F–K, P). Data are shown as the mean ± s.d. ns, not significant, P > 0.05; *P < 0.05; **P < 0.01; ***P < 0.001.
Source data are available online for this figure.
