
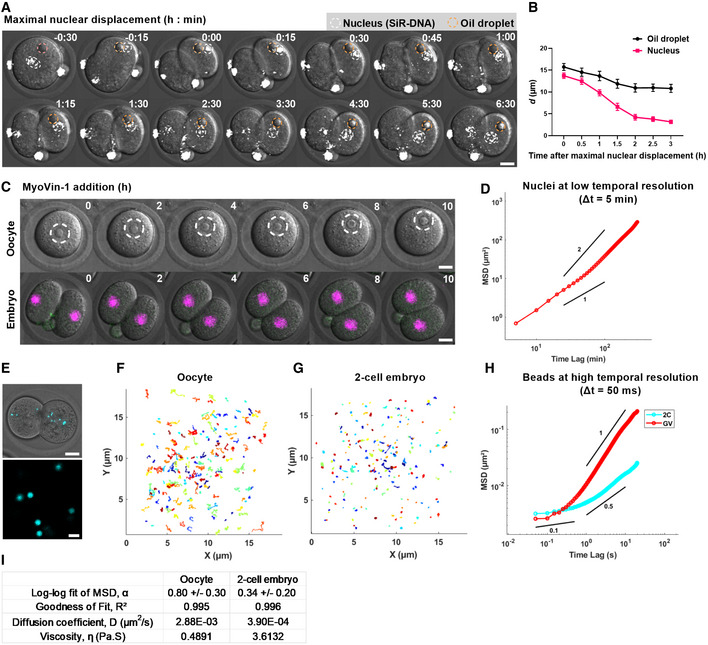
Figure 5. Non‐diffusive nuclear centring and high cytoplasmic viscosity in 2‐cell embryos.
-
ARepresentative time‐lapse images of 2‐cell embryos cultured with SiR‐DNA to label nuclei (white circles) and microinjected with oil droplets (yellow circles). Time is shown as h:min relative to maximal nuclear displacement.
-
BPlot of the distances between oil droplets and nuclei to the cell centre over time (n = 14 oil‐nucleus pairs).
-
CRepresentative time‐lapse images of prophase I‐arrested oocytes (upper panel, dashed circles outline nuclei) (n = 16 oocytes) and 2‐cell embryos microinjected with H2B‐RFP to label DNA (n = 14 embryos) following treatment with MyoVin‐1. Time is shown as h post‐drug addition.
-
DMSD analysis of nuclear displacement during re‐centring (n = 26 blastomeres). Power‐law slopes of 1 and 2 are drawn for comparison.
-
ETop panel: an example of fluorescent bead distribution in a 2‐cell embryo. Lower panel: an example of region imaged for bead tracking at high temporal resolution.
-
F, GTrajectories of bead movement over a 20‐s duration in oocytes (F, n = 217 beads from 23 oocytes) and 2‐cell embryos (n = 277 beads from 26 embryos). Each coloured line represents a single bead track.
-
HMSD plot of beads in oocytes (n = 217 beads from 23 oocytes) and 2‐cell embryos (n = 277 beads from 26 embryos). Power‐law slopes of 1, 0.5 and 0.1 are drawn for comparison.
-
IResults obtained from MSD analysis. α represents the slope of the log–log fit of the MSD curve using the first 25% (100 data points). D represents the diffusion coefficient estimated from the linear fit of the MSD curve.
Data information: Scale bar = 20 μm in A, C, E, except 2 μm in the lower panel of E. In (B), data are shown as mean ± SEM. In (D, H), the ensemble‐averaged MSDs are shown.
Source data are available online for this figure.