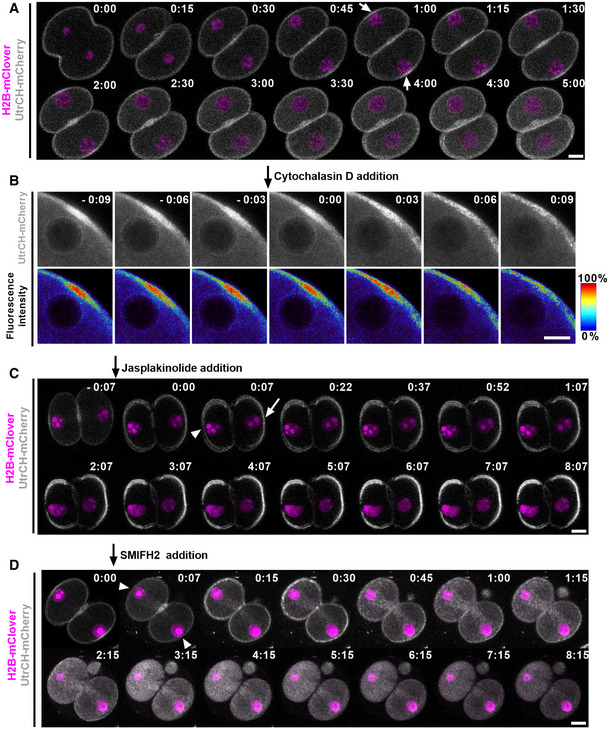
Figure 6. Actin‐dependent nuclear positioning in 2‐cell embryos.

-
ARepresentative time‐lapse images of F‐actin (UtrCH‐mCherry) and nuclei (H2B‐mClover). Time is shown as h:min relative to anaphase onset. Arrows indicate high UtrCH‐mCherry intensity (n > 30 embryos).
-
BRepresentative time‐lapse imaging of F‐actin (UtrCH‐mCherry) after cytochalasin D addition (n = 10 blastomeres). Time is shown as h:min relative to drug addition. The look‐up table shows the colour scale corresponding to fluorescence intensity ranging from 0 to 100% of maximum.
-
C, DRepresentative time‐lapse imaging of F‐actin (UtrCH‐mCherry) after Jasplakinolide (C, n = 11 blastomeres) and SMIFH2 (D, n = 9 blastomeres) addition. Time is shown as h:min relative to drug addition. Arrows indicate increased UtrCH‐mCherry intensity relative to the last frame, and arrowheads indicate decreased UtrCH‐mCherry intensity.
Data information: In (A–D), data shown are representative examples of biological replicates as specified. Images are the maximum intensity projection of 3 z‐slices. Scale bars = 20 μm except in (B), scale bar = 10 μm.
