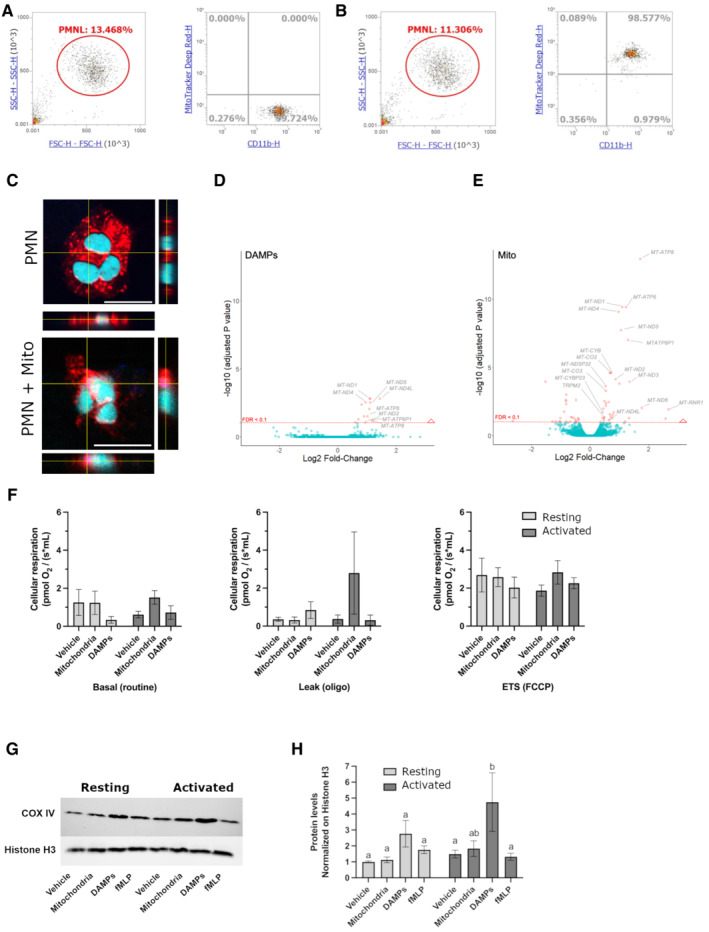
Figure 1. Modulatory effects of freeMitos on human polymorphonuclear leukocytes.

-
A, BFunctional freeMitos association with PMN. Overlay dot plot population, representative of four biological replicates of the flow cytometry gating strategy used to quantify the interaction between PMN (anti‐CD11b‐PE) and freeMitos. Freshly isolated platelets were labeled with MitoTracker™ Deep Red and freeMitos isolation was subsequently performed. CD11b‐labeled PMN were incubated in absence (A) or presence (B) of freeMitos at a 1:5 ratio (PMN:mitochondria).
-
CConfocal microscopy imaging of PMN cell membrane (red) labeled with CellMask Orange in absence (upper panel) or presence (lower panel) of MitoTracker™ Deep Red‐labeled freeMitos (magenta). PMN nuclei were stained with DAPI (cyan). The white scale bars shown in the lower right of the images represent 10 μm in size.
-
D, EFreeMitos associate with PMN and modulate gene expression. Volcano plot, of four biological replicates, representing the gene expression modulation induced by mitochondrial DAMPs preparation (D) and freshly isolated functional freeMitos (E) in PMN.
-
F–HFreeMitos effect on the respiratory state of PMN. O2 consumption rates of resting or activated (incubated with TNF‐a and GM‐CSF). PMN were measured using high‐resolution O2 respirometry (Oroboros Oxygraph) and revealed no significant differences between the basal state (left panel), leak state (middle panel), and the maximum electron transport system capacity (ETS, right panel) of cellular respiration (F). Immunoblot of mitochondrial cytochrome c oxidase (COX IV) and histone H3 as a loading control of PMN after co‐incubations with freeMitos (G) with subsequent densitometry analysis (H).
Data information: For panels (F) and (H), data are shown as means ± SEM, of three biological replicates. Two‐way ANOVA tests followed by Tukey's multiple comparisons tests for each sample was performed for panels (F) and (H). Values without at least one common superscript letter are different (P < 0.05).
Source data are available online for this figure.
