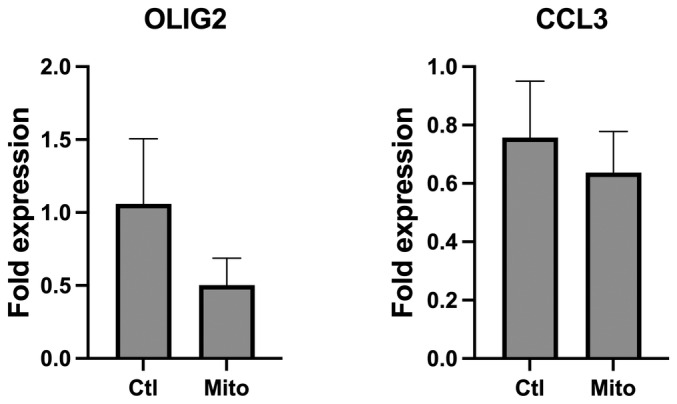
Figure EV1. Validation of the transcriptomic analysis by qPCR.

Transcript levels of oligodendrocyte transcription factor 2 (OLIG2) and the C–C motif chemokine ligand 3 (CCL3) in PMNL incubated with platelet‐derived mitochondria (Mito) or absence (Ctl) were assessed by qRT‐PCR. Results are expressed as the mean ± SEM of three biological replicates, each performed in three technical replicates. A paired sample t‐test was performed to determine P‐values of 0.1711 (OLIG2) and 0.4504 (CCL3).
