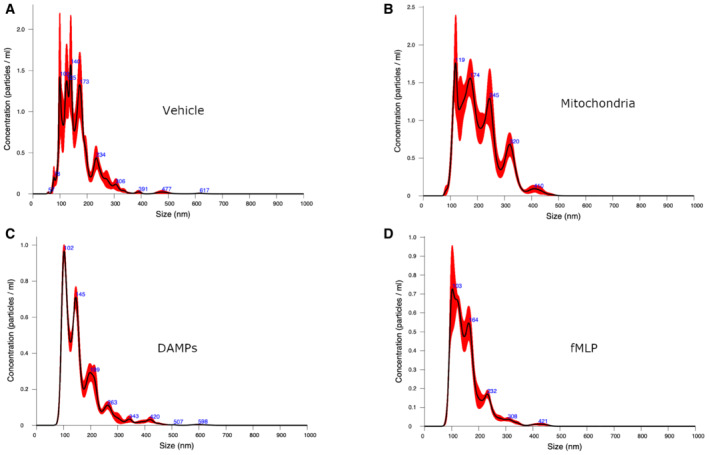
Figure EV2. Sizing of the vesicles released from PMN.

-
A–DPMN‐MVs sizing by nanoparticles tracking analysis (Nanosight) of the supernatant of PMN incubated with either the vehicle (HBSS, panel A), platelet‐derived mitochondria (panel B), platelet‐derived DAMPs (panel C) or fMLP (panel D). Data shown are representative of three biological replicates. The size distribution and concentration of MVs from PMN supernatant were measured using NanosightNS300 (Malvern Panalytical). Sample were prepared for nanoparticle tracking analysis by diluting the stock material in particle‐free water until the concentration was between 1 × 10⁸ and 1 × 10⁹ particles/ml and six videos of 30 s were captured. At least two different dilutions resulting from the stock concentration were analyzed for each sample. The screen gain was set to 10 and the camera level to 16. After capture, the videos were analyzed by the Nanosight Software v3.2 with a detection threshold of 5.
