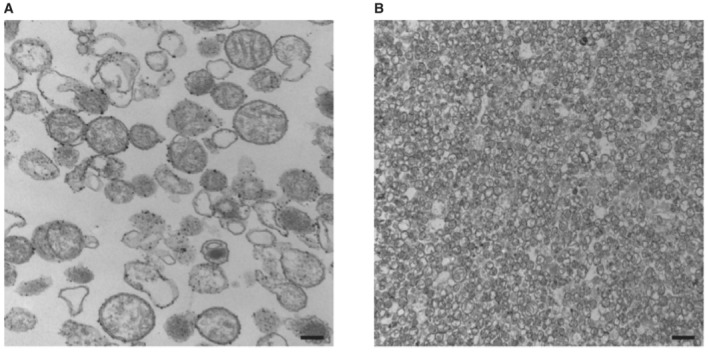
Transmission electron microscopy imaging of our mitochondria preparation and purification as previously reported (Léger
et al,
2020, 2021). The black scale bars shown in the lower right of panels (A) and (B) represent sizes of 200 nm and 1 μm, respectively.

