-
A
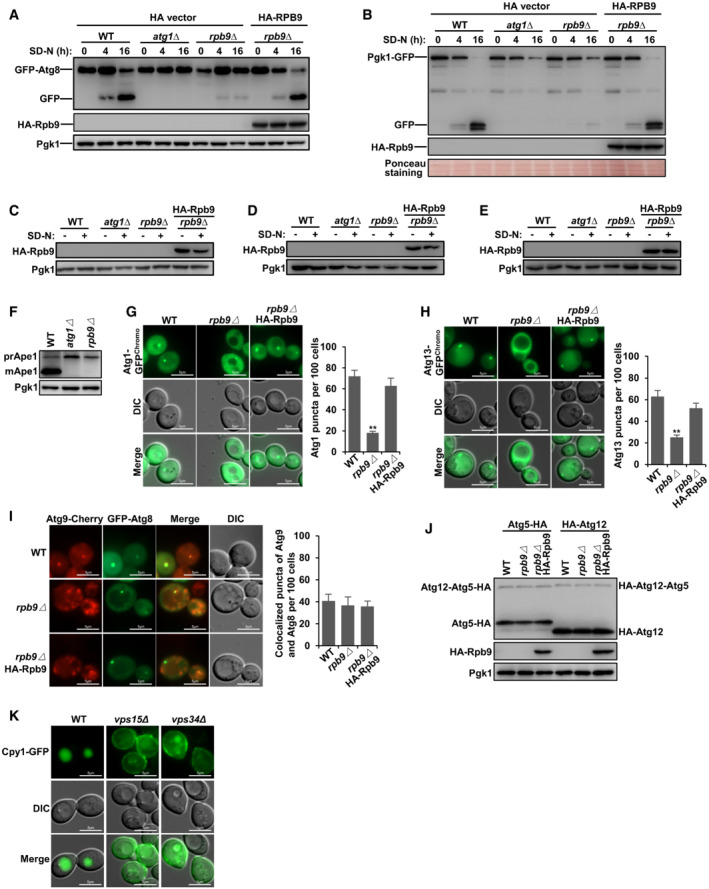
N‐terminally GFP‐tagged Atg8 was checked for its autophagic degradation in indicated yeast cells by GFP processing assays after 0, 4, and 16 h starvation. Yeast cells with ATG1 deletion were used as positive controls.
-
B
C‐terminally GFP‐tagged Pgk1 was checked for its autophagic degradation in indicated yeast cells by GFP processing assays after 0, 4, and 16 h starvation. The PVDF membrane was subject to Ponceau staining and used as a loading control.
-
C–E
Expression determination of HA‐Rpb9 in experiments Fig
2D, F, and G.
-
F
Autophagic transfer of endogenous Ape1 in indicated yeast cells was analyzed at rich medium conditions.
-
G
Atg1 puncta was regulated by Rpb9. Atg1 was C‐terminally GFP tagged in chromosome and its puncta in indicated yeast cells after 4‐h SD‐N starvation was observed and quantified. Bars represent mean, error bars represent standard deviation, significance was determined by one‐way ANOVA (unpaired) followed by Tukey's multiple comparison test, **indicates P < 0.01 (n = 5 biological replicates). Scale bars: 5 μm.
-
H
Atg13 puncta was regulated by Rpb9. Atg13 was C‐terminally GFP tagged in chromosome and its puncta in indicated yeast cells after 4‐h SD‐N starvation was observed and quantified. Bars represent mean, error bars represent standard deviation, significance was determined by one‐way ANOVA (unpaired) followed by Tukey's multiple comparison test, **indicates P < 0.01 (n = 5 biological replicates). Scale bars: 5 μm.
-
I
Atg9 recruitment to Atg8 puncta was not regulated by Rpb9. C‐terminal Cherry tagged Atg9 and N‐terminal GFP tagged Atg8 were expressed in indicated yeast cells and their puncta co‐localization was observed and quantified. Bars represent mean, error bars represent standard deviation, significance was determined by one‐way ANOVA (unpaired) followed by Tukey's multiple comparison test (n = 5 biological replicates). Scale bars: 5 μm.
-
J
Atg12‐Atg5 conjugation was not regulated by Rpb9. C‐terminal HA‐tagged Atg5 and N‐terminal HA‐tagged Atg12 were expressed in indicated yeast cells and the Atg12‐Atg5 conjugation levels were analyzed.
-
K
Vacuole transfer of Carboxypeptidases Y (Cpy1) by the secretory pathway was analyzed in WT, vps15∆, and vps34∆ cells. Scale bars: 5 μm.

