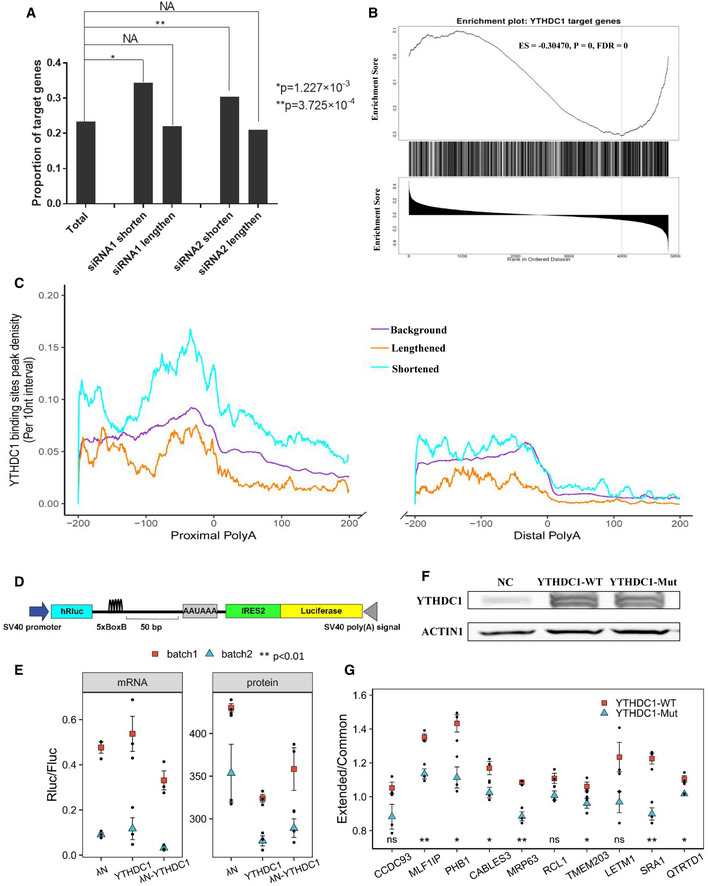
Figure 2. YTHDC1 inhibits proximal APA sites in an m6A‐dependent manner.

- Higher proportion of target genes in the list of genes with shortened 3′UTRs after knockdown of YTHDC1. The P values were obtained by Fisher's exact test. *P = 1.227 × 10⁻³, **P = 3.725 × 10⁻⁴, NA: no significance.
- Gene set enrichment analysis shows that YTHDC1 target genes are significantly enriched at the bottom of the list of genes ranked by Pearson correlation r (extracted from the linear trend test), suggesting that target genes tend to use shorter 3′ UTRs after YTHDC1 knockdown. ES: enrichment score; FDR: false discovery rate.
- Peak density distribution of YTHDC1 binding sites near different poly(A) sites. Genes with shortened 3′ UTR show a higher density of YTHDC1 binding peaks near proximal APA sites compared to background genes. The density of YTHDC1 binding site peak was calculated as the number of peak in a 10‐nt interval divided by the total number of mRNAs that contained this position.
- Schematic diagram of the bicistronic vector for the dual luciferase reporter assay. The PHB PAS and SV40 PAS were used as proximal and distal APA processing signals, respectively. The 5 × BoxB sequence was inserted 50 bp upstream of the PHB PAS. The ratio of Rluc/Fluc reflects the switch of APA sites.
- Scatter plot of protein and mRNA ratios of dual luciferase report assay with λN‐BoxB system. λN, YTHDC1 and λN‐YTHDC1 were co‐transfected with a bicistronic vector. Two batches of experiments with three biological repeats were performed. Both luciferase activity and mRNA levels were measured. To test the effect of YTHDC1 binding on the proximal APA site, a linear model with the co‐transfected genes and batch as independent variables was fitted. Data are presented as mean ± SEM of three biological replicates. **P < 0.01 with t‐test from linear model.
- Overexpression of YTHDC1‐WT and YTHDC1‐Mut (W377A, W428A) revealed by Western blot.
- Scatter plot of qRT‐PCR for APA validation. Mutation of the m6A binding site of YTHDC1 loses its inhibitory effect on proximal APA sites. Extended/Common ratios of 10 genes were obtained by qRT–PCR in HEK293T cells overexpressing YTHDC1‐WT and YTHDC1‐Mut. The ratios were normalized to those of control cells. Data are presented as mean ± SEM of three biological replicates. *P < 0.05, **P < 0.01, ns: no significance. The P values were obtained from unpaired two‐tailed Student's t‐test.
Source data are available online for this figure.
