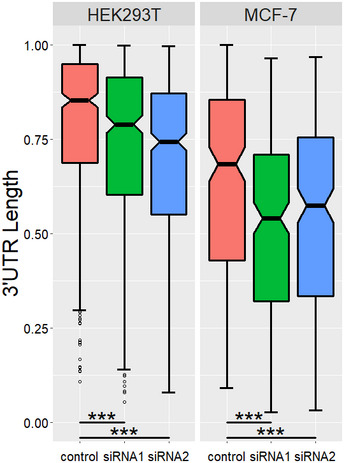
Figure EV2. Notched boxplot of weighted mean of 3′ UTR length.

For each gene that undergoes 3′ UTR shortening, the length of each 3′ UTR isoform was normalized to the longest 3′UTR, and the weighted mean of 3′ UTR length was calculated. ***P < 3.18 × 10−39, P values were obtained with paired t‐test.
