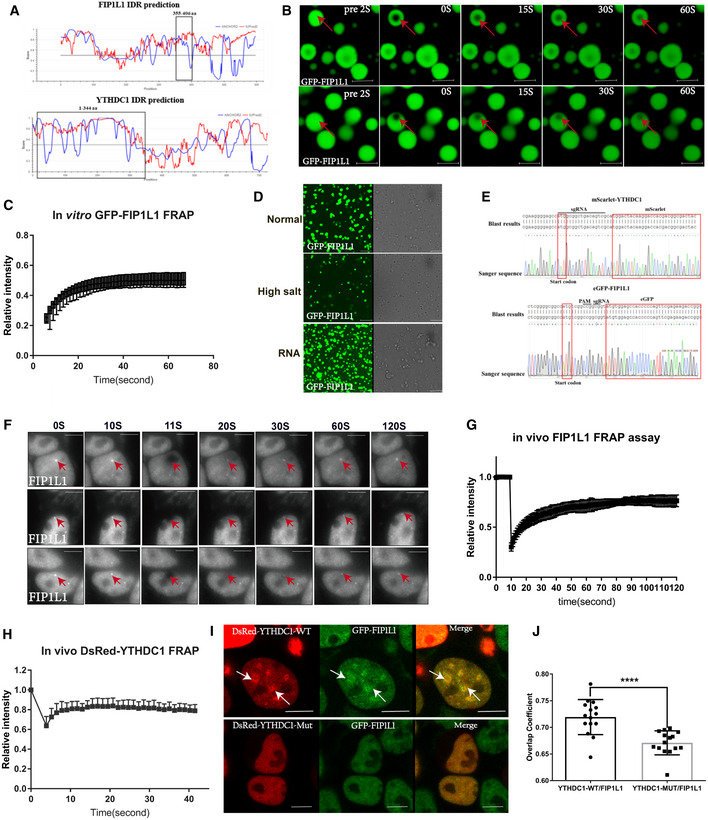
Figure 7. YTHDC1 forms nuclear condensates through LLPS and compartmentalizes FIP1L1 in an m6A‐dependent manner.

-
ADiagram of the IDRs prediction of YTHDC1 and FIP1L1. The regions in the black box represent the interacting domain between YTHDC1 and FIP1L1 with a high disorder score.
-
BMicroscopy images of fluorescence recovery following partial photobleaching of GFP‐FIP1L1. Normal solutions containing 2.1 mg/ml GFP‐FIP1L1 were examined with a microscope at different time points. Scale bars: upper 3 μm, lower 2.98 μm.
-
CFRAP assay of GFP‐FIP1L1. Quantification of average relative fluorescence intensity and its initial rate of area of photobleaching across eight individual GFP‐FIP1L1 droplets. Data are presented as mean ± SD of eight biological replicates.
-
DThe GFP‐FIP1L1 phase separation assay was performed in normal buffer, high salt buffer and normal buffer with the addition of RNA. All these results indicated that the GFP‐FIP1L1 protein displayed dynamic and liquid‐like properties. Scale bars 15 μm.
-
ESanger sequencing was used to genotype eGFP‐FIP1L1 and mScarlet‐YTHDC1 homozygous cell lines.
-
FIn vivo FRAP assays for eGFP‐FIP1L1 and DsRed‐YTHDC1 were examined by time‐lapse phase‐contrast imaging. The arrows represent droplet of GFP‐FIP1L1. Nine cell‐independent experiments were selected for FRAP assays. Scale bars 10 μm.
-
G, HQuantification of average relative fluorescence intensity and its initial rate of area of photobleaching across 15 individual GFP‐FIP1L1 droplets in (G) and DsRed‐YTHDC1 in (H), respectively. Data are presented as mean ± SD of 15 biological replicates.
-
IGenome‐edited eGFP‐FIP1L1 HEK293T cells expressing Dsred‐YTHDC1‐WT and Dsred‐YTHDC1‐Mut were examined by confocal microscopy. DsRed‐YTHDC1‐WT forms LLPS to compartmentalize FIL1L1, but DsRed‐YTHDC1‐Mut diffuses in the nucleus without droplet structure. Droplet structures are indicated by arrows. Scale bars: upper 8.09 μm, lower 6.64 μm.
-
JCo‐localization of YTHDC1‐WT and YTHDC1‐Mut in (I) was assessed by calculating the average overlap coefficient according to Leica TCS SP8 microscope software. Data are presented as mean ± SEM of 15 cells. ****P = 6.46 × 10⁻⁴, the P values were obtained with unpaired two‐tailed Student's t‐test.
Source data are available online for this figure.
