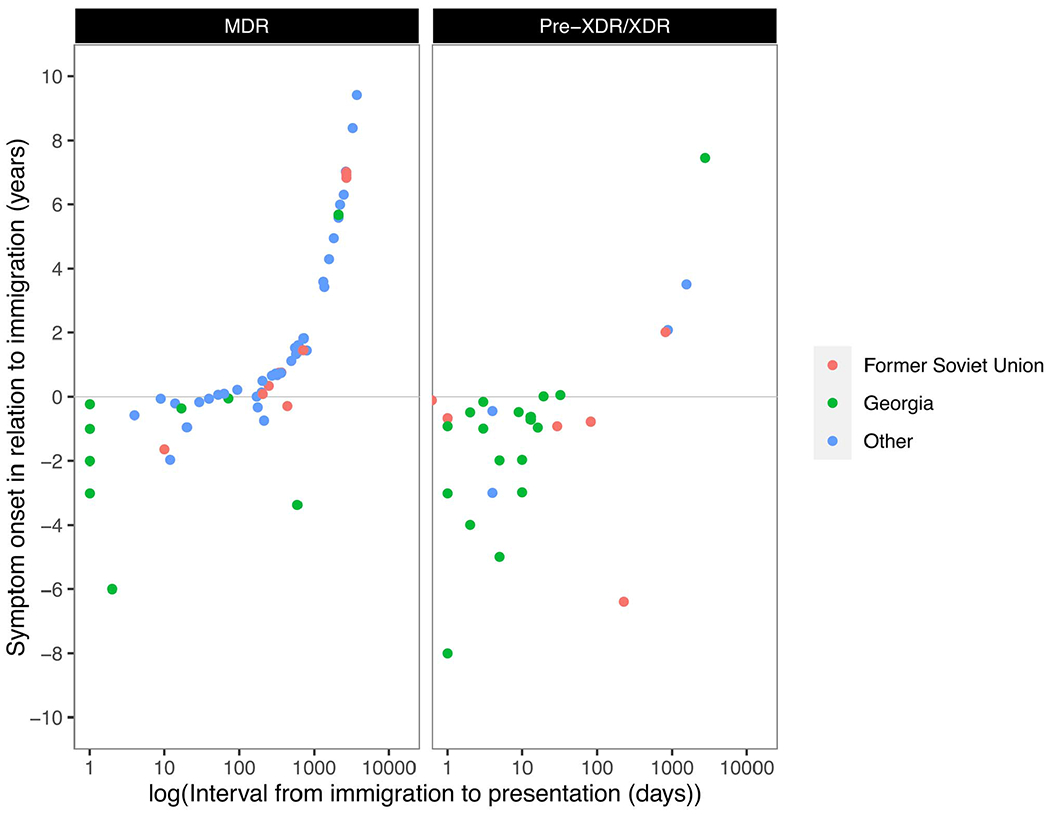
Figure 2.

Correlation of time intervals from immigration to presentation (x, logarithmic) and from symptom onset to immigration (y, linear) for patients with MDR-TB (left) and higher degree of resistance (pre-XDR/XDR, right). Intercept (y = 0) = time point of immigration
