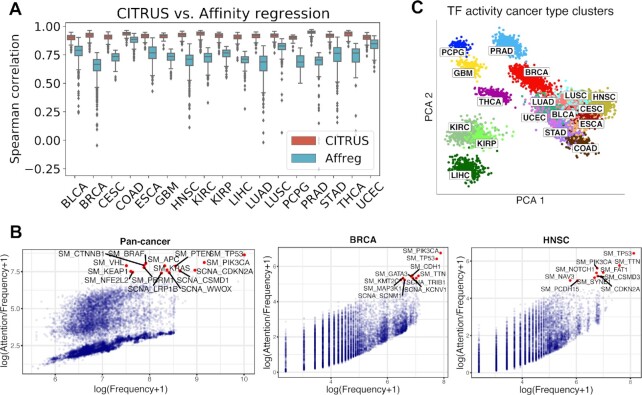
Figure 2.
CITRUS models the impact of somatic alterations on gene expression programs. (A) Performance of CITRUS in each cancer type compared to the regularized bilinear regression method Affinity regression (Affreg). Boxplots show the mean Spearman correlations between predicted and actual gene expression based on CITRUS (orange) and Affreg (light blue) in TCGA datasets for each cancer type. Both CITRUS and Affreg were tuned on the same training and validation sets and evaluated on the same testing set. (B) Somatic alteration frequencies and CITRUS-inferred attention weights of genes. Cumulative pan-cancer results are shown on the left, and individual BRCA and HNSC results are shown in the middle and on the right, respectively. See Supplementary Fig. 1 for complete results from each cancer type. (C) Principal component analysis (PCA) of TF activity colored by cancer type. Standard TCGA tumor symbols are used to indicate tumor type.

