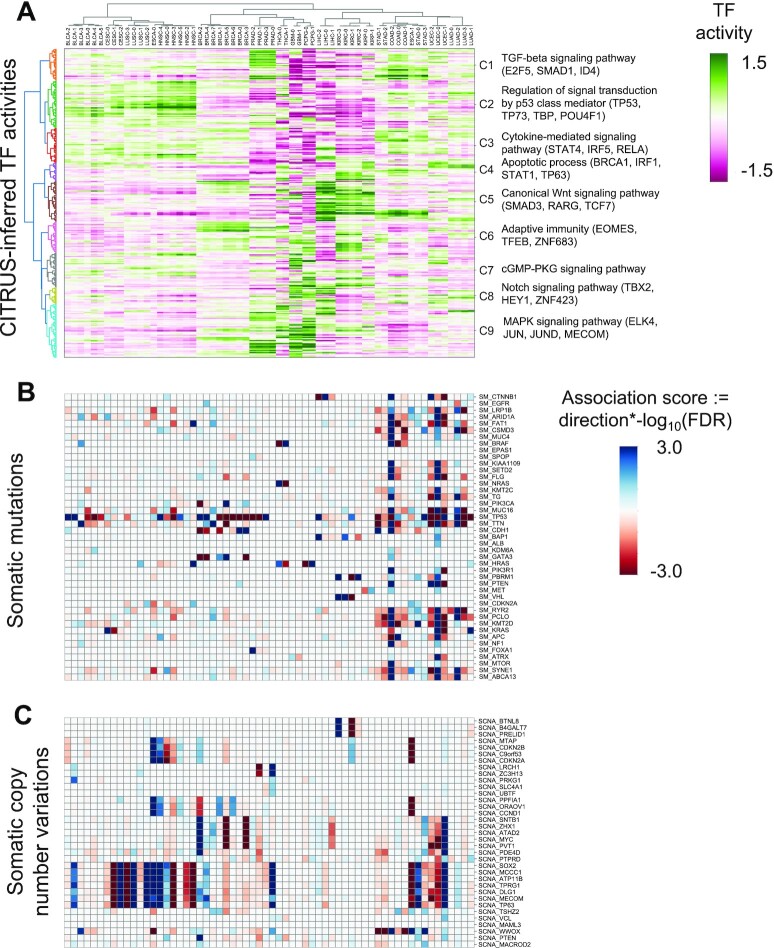
Figure 4.
Landscape of somatic alterations and inferred TF activities. (A) Heatmap shows tumor subtypes clustered by mean inferred TF activity. The color scale is proportional to TF activity. (B, C) Heatmaps of association scores for (B) mutations and (C) copy number variations. Association scores were calculated by multiplying the −log10 FDR by the direction derived from Fisher's exact test.

