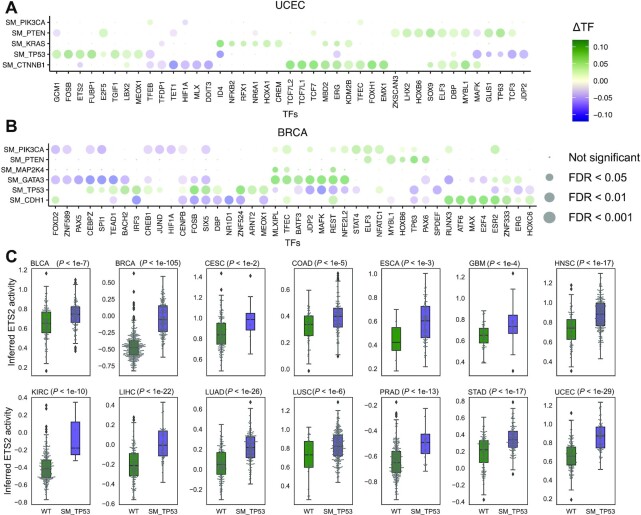
Figure 5.
Somatic alterations are associated with dysregulated TF activity. Impact of somatic alterations on individual TFs based on in silico knock out experiments in (A) UCEC and (B) BRCA datasets from TCGA. The dot plot shows mean TF activity, and dot size indicates –log10(FDR). Vertical axis are mutations and horizontal axis are TFs associated with at least on the mutations. The experiment and control groups are whether the mutation present or not in the patient. To evaluate the impact of mutations on TF activities, we conducted Student's t-test on the two groups. See Supplementary Figure 4 for the full list of cancer types. (C) Inferred ETS2 activity in TCGA studies and impact of TP53 mutations. Tumors with mutant TP53 have significantly higher ETS2 activity than WT tumors (P < 0.01, t-test). This association is not significant using mRNA levels of ETS2 (Supplementary Figure 6). Box edges represent the upper and lower quantile with median value shown as a bold line in the middle of the box. Whiskers extend to 1.5 times the quantile.

