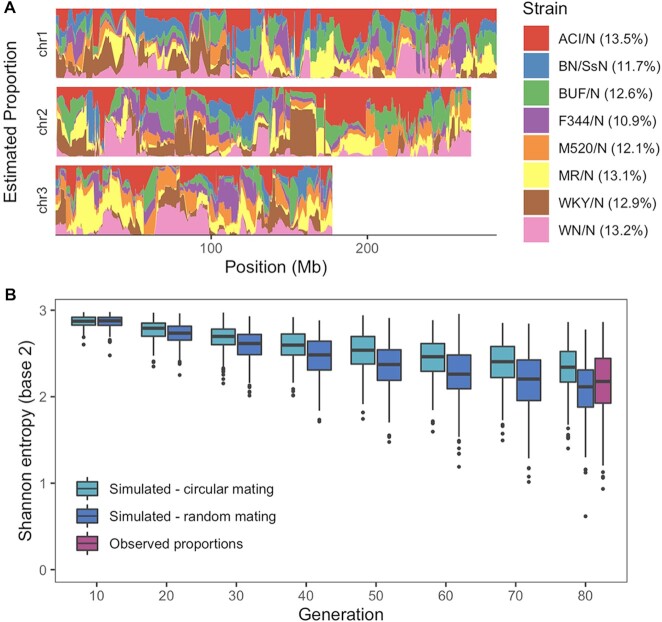
Figure 2.
HS founder haplotype diversity. (A) Estimated haplotype proportions across three chromosomes in the 88 HS rats. The total proportions over all autosomes are shown in the legend. (B) Simulated and observed haplotype diversity in the HS population. Diversity (Shannon entropy of mean strain probabilities at each locus) is shown for every tenth generation for the simulated data. Each simulation type was run 200 times, representing 200 independent loci, and 200 real loci were sampled from the real cohort from HS generations 73–80.

