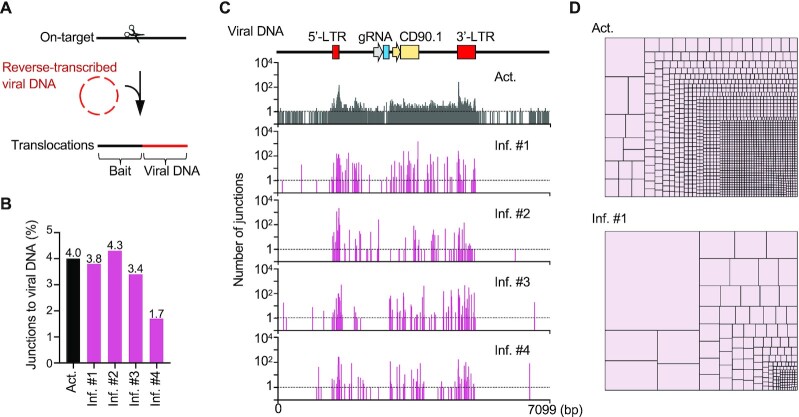
Figure 3.
Viral DNA insertions in the edited T cells undergo clonal expansion after infusion. (A) Schematic of viral DNA insertions identified by PEM-seq. The prey sequences aligned to the viral genome indicate viral DNA integration. (B) Percentages of junctions to viral DNA among the editing events. The total editing efficiency is indicated in Figure 1B. (C) Distribution of junctions in the viral genome with a 1-bp bin. The functional elements of the viral DNA are shown on the top. (D) Tree map showing the proportion of each junction to the viral genome at a single-nucleotide resolution. Each rectangle represents a unique junction, and the area of the rectangle represents percentage of the indicated junction.

