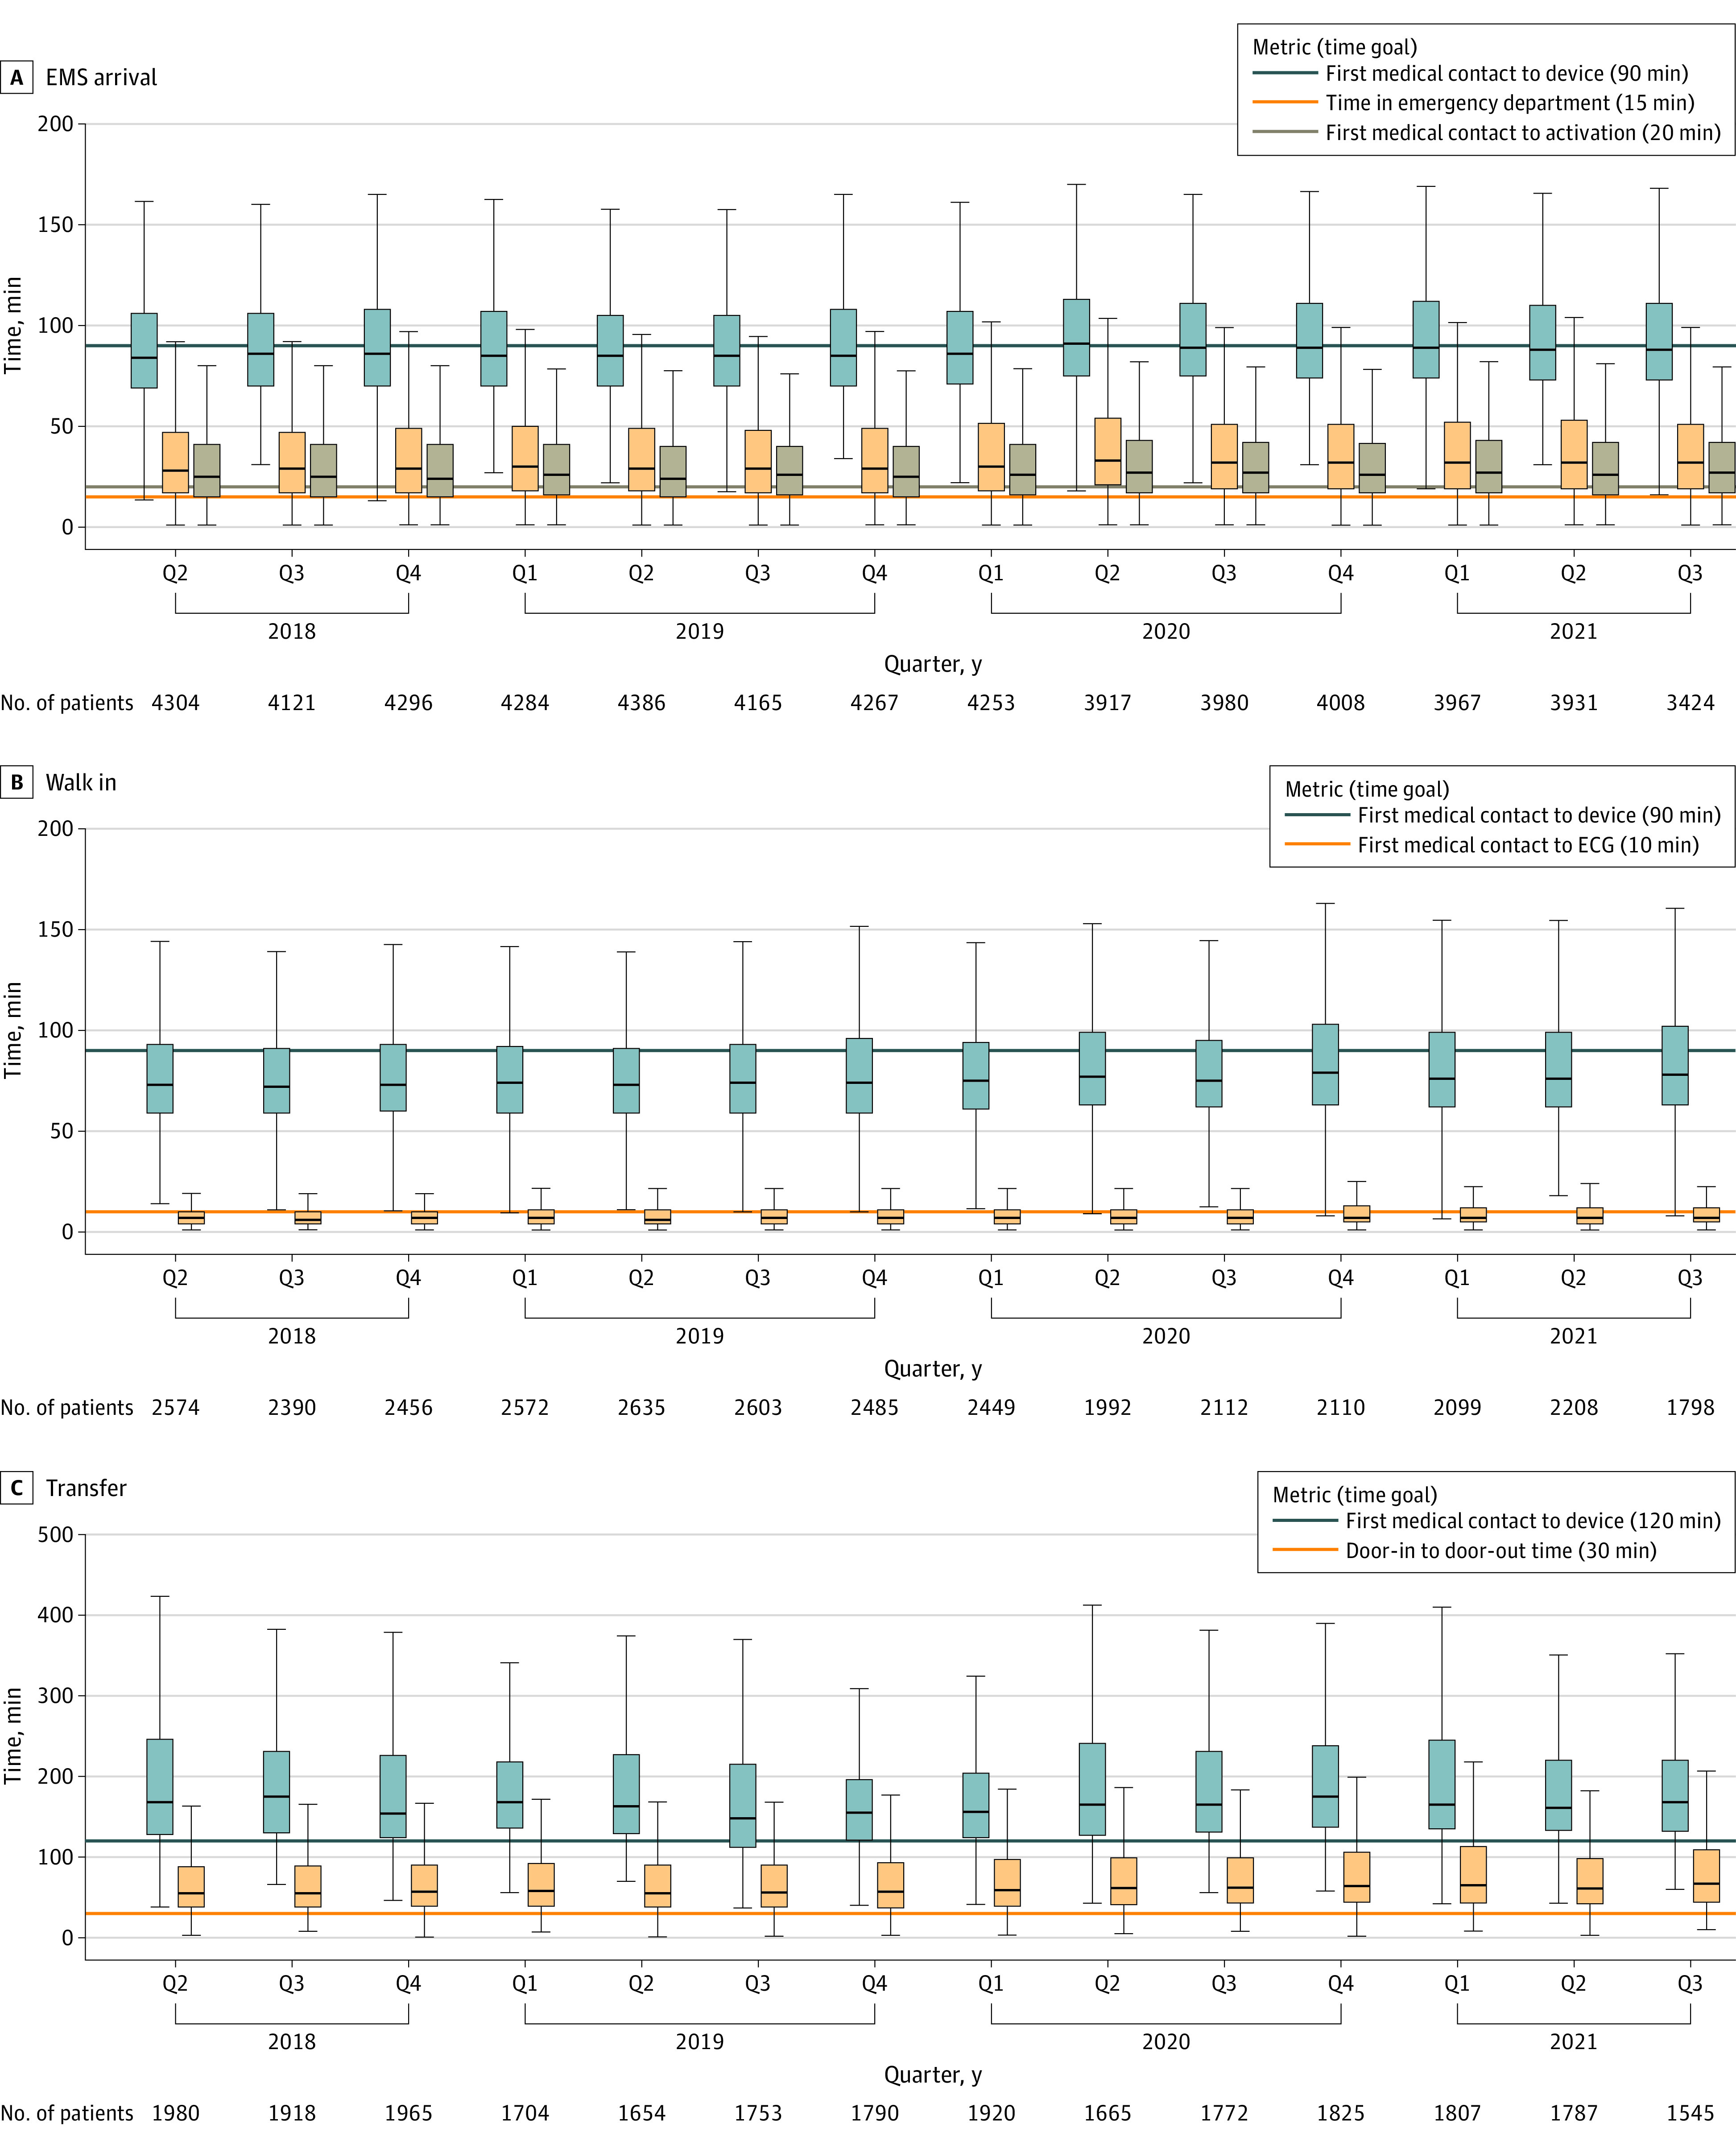
Figure 2. Process Time Measures by Year, Quarter, and Mode of Presentation.

The horizontal line in each box indicates the median, the top and bottom of the boxes indicate the IQR, and the whiskers indicate the absolute range. The horizontal lines indicate the quality initiative for time goals for treating 75% of patients. EMS indicates emergency medical services.
