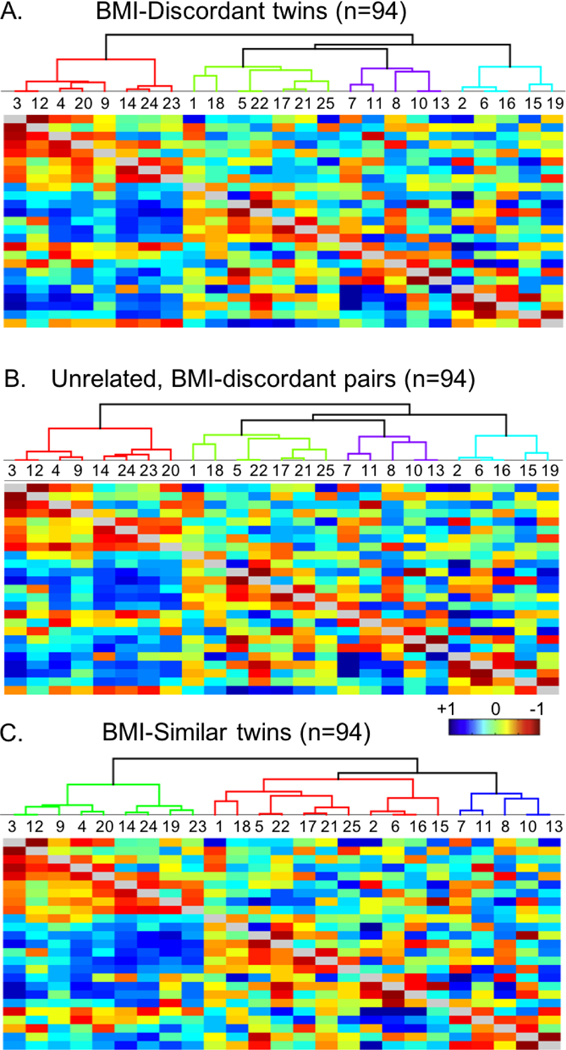
Figure 3.
Hierarchy and correlation heatmaps of resting state network connectivity in the three independent samples tested: A) BMI- discordant twins; B) unrelated, BMI-discordantpairs; C) BMI similar twins, for the 25-network parcellation. Each map shows the parcel hierarchy at the top (brackets); independent component (1C) numbers listed in the row below the hierarchy; full correlation values in the upper portion of the heatmap, and partial correlation values in the lower portion of the heatmap.

