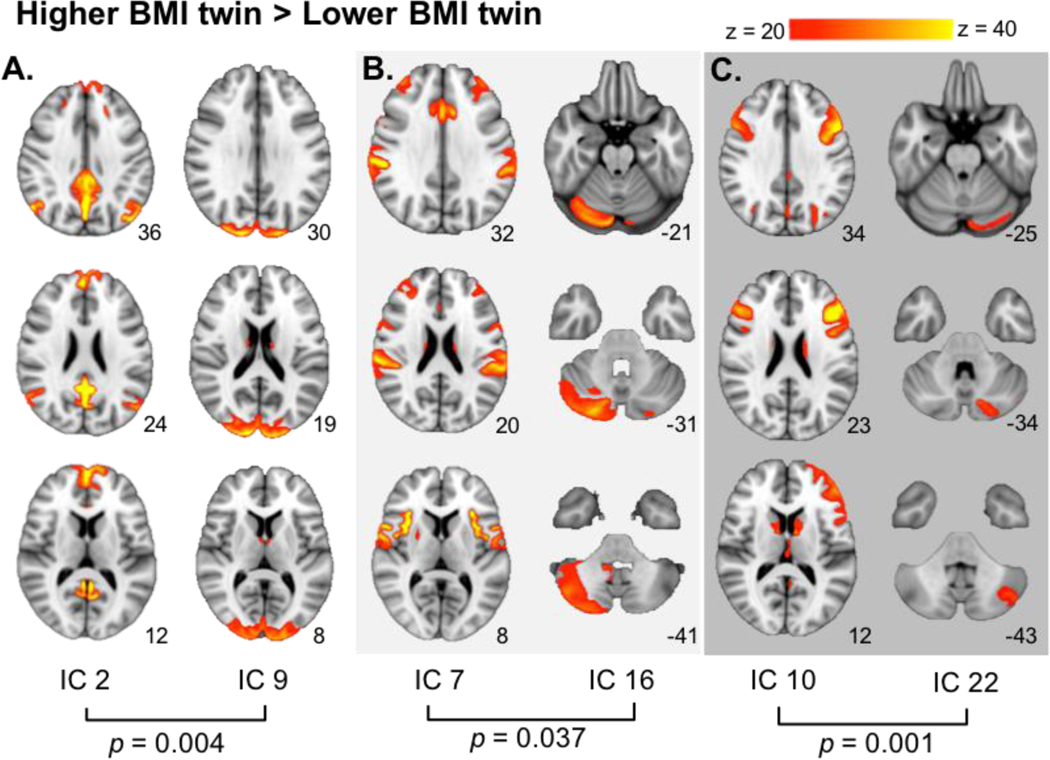
Figure 4.
Differential network connectivity in the BMI-discordanttwin sample. When contrasting higher BMI > lower BMI, stronger connectivity was seen between: A. the default mode network (1C 2) and the occipital pole (1C 9): B. the insula, central operculum, precentral gyrus and anterior cingulate (1C 7) and right crus I of the cerebellum (1C 16); C. the dorsolateral prefrontal cortex and ventrolateral prefrontal cortex (IC 10) and the left crus II (IC 22). MNI coordinates of each slice on the z-axis are listed below each slice.

