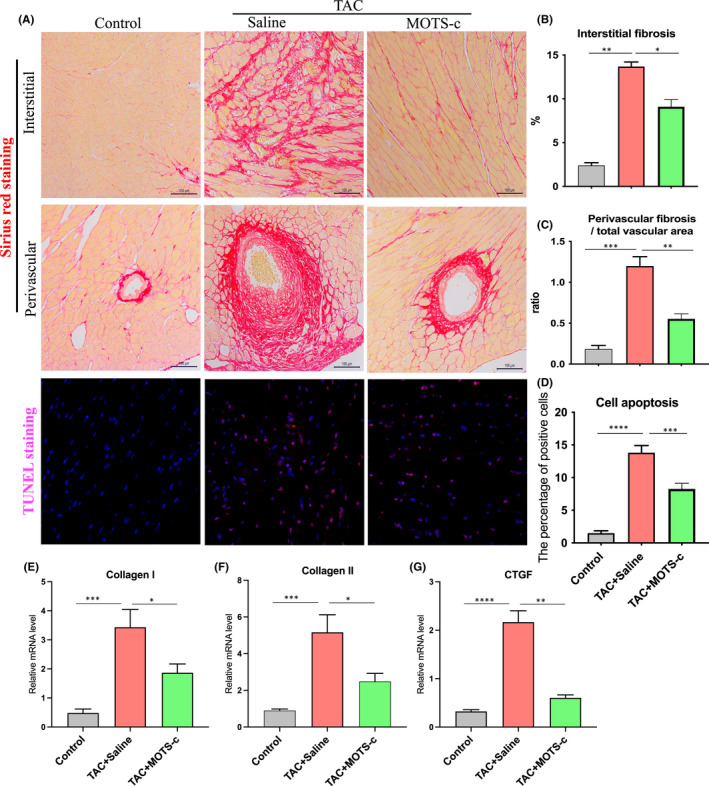
FIGURE 2.

Administration of MOTS‐c peptide attenuated cardiac fibrosis and apoptosis in transverse aortic constriction (TAC)‐induced HF mice. (A) Representative images of Sirius red staining and TUNEL staining of the cardiac tissues. The quantitative data for the interstitial and perivascular fibrosis are shown in B and C; The quantitative data for the TUNEL positive cells in the heart are showed in D. (E–G) The mRNA level of collagen I, collagen II, and CTGF in the heart tissues. Data are represented as the mean ± SEM, n = 5–6 in each group, *p < 0.05; **p < 0.01; ***p < 0.001; ****p < 0.001
