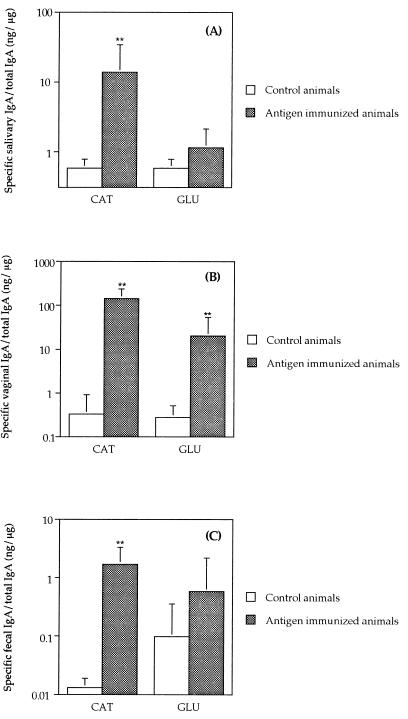
FIG. 5.
Salivary IgA (A), vaginal IgA (B), or intestinal IgA (C) responses to CAT or GLU 1 week after the third i.n. immunization. Results are shown as the geometric means of the specific IgA response/total IgA (×/÷ the SD) for five mice immunized with CAT or GLU or for nonimmunized controls. The antibody activities were significantly different from nonimmunized mice at a level of P < 0.0001 (∗∗).

