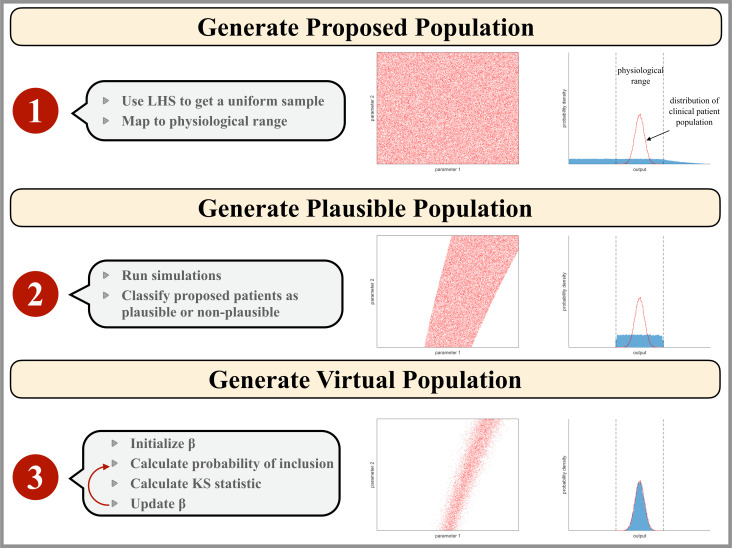
Figure 2.
Illustration of the virtual patient generation algorithm. Input parameter values are represented as red points in a two-dimensional parameter space which would correspond to a hyperspace for our model analysis. The blue histogram represents the model outputs that correspond to the clinical patient data available. The physiological range of output values is outlined by black dashed lines and the empirical distribution of the clinical population data is shown as a red line. Step 1: the proposed patient population is generated by mapping a Latin Hypercube Sampling (LHS) on the interval (0–1) to parameter space assuming a physiological parameter range for each parameter. Step 2: the plausible patient population is the subset of the proposed patient population whose simulation outputs are physiologically realistic. Step 3: the virtual patient population is a subset of the plausible patient population such that the distribution of virtual patient outputs reflects that of the clinical patient population.

