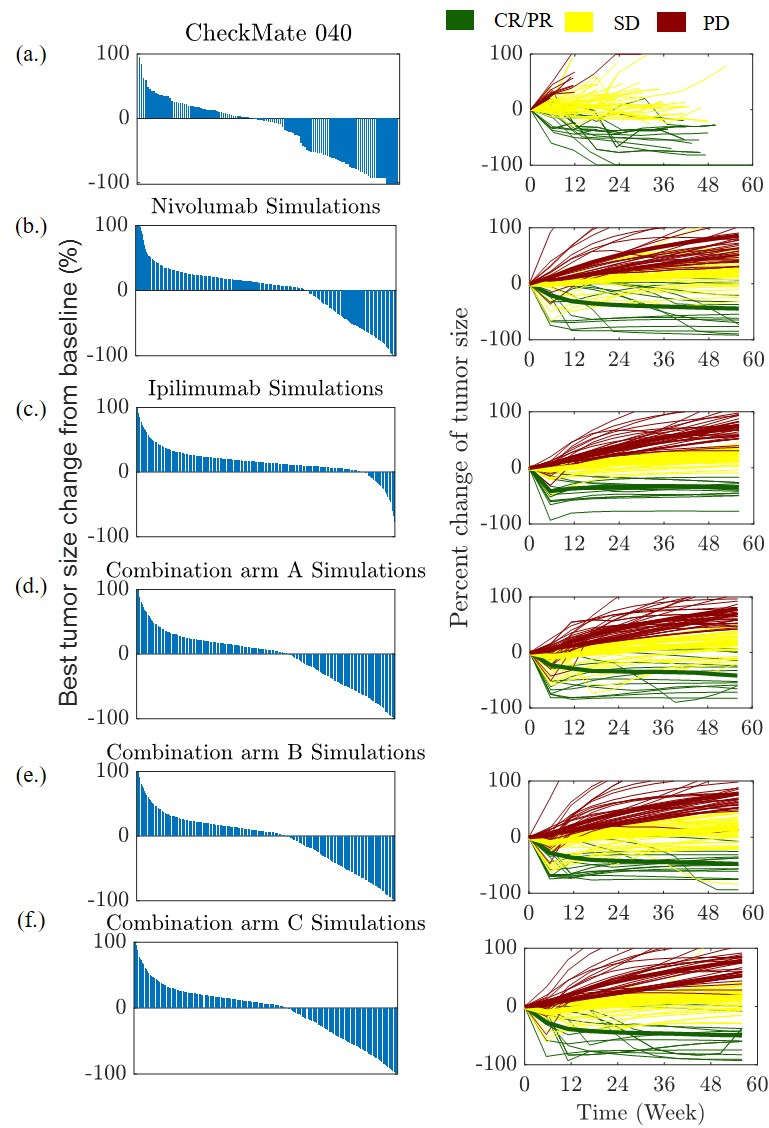
Figure 5.

Waterfall (left) and spider plots (right) are shown for clinical trial CheckMate 040 and as predicted by the proposed QSP model for HCC. (A) CheckMate 040, (B) monotherapy of nivolumab, (C) ipilimumab monotherapy, combination treatments for (D) arm A (E) arm B (F) arm C. The waterfall plots show the best percent change in tumor diameter from baseline for each patient in the trial. The spider plots show the per cent change in tumor diameter at each measurement time point (every 6 weeks) for 100 randomly selected virtual patient. CR, complete response; HCC, hepatocellular carcinoma; PD, progressive disease; PR, partial response; QSP, quantitative systems pharmacology; SD, stable disease.
