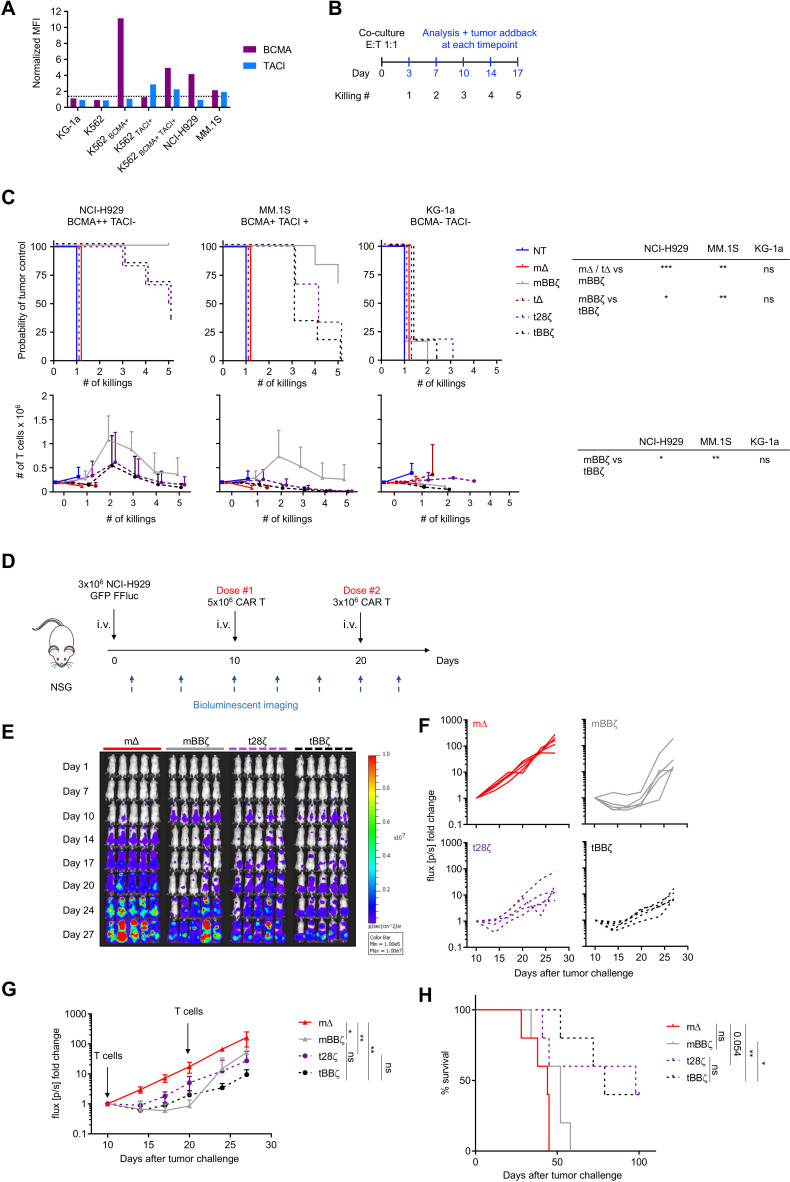
Figure 2.
In vitro and in vivo antitumor function of APRIL CAR T cells. (A) BCMA and TACI expression on cell lines relative to isotype control staining. (B) Scheme of rechallenge co-culture stress test, effector to target ratio E:T 1:1. (C) Kaplan-Meier curves in the top row depict probability of tumor control in the rechallenge co-culture stress test, n=6 donors, log-rank test (table top right). Line graphs show T cell expansion in co-cultures, n=6, mean±SD, unpaired t-test with Welch’s correction on AUC (table bottom right). (D) Scheme of the in vivo experimental timeline. 1 of 2 representative experiments shown, n=5 mice per group per experiment. (E) Tumor growth measured by BLI, individual mouse pictures (color scale min 1×10⁵, max 1×10⁷ p/s/cm2/sr). Dorsal view identifies tumor growth in the spine and skull. (F) Individual line graph of tumor growth for each mouse per group. BLI flux (p/s) normalized to signal intensity measured on day 10. (G) BLI flux summary n=5, mean±SD. Unpaired Mann-Whitney-U test (non-parametric t-test) on AUC. (H) Survival of mice as defined by humane end-point criteria. Log-rank test. (C, G, H) Definition of significance levels: ns=not significant, *p<0.05, **p<0.01, ***p<0.001. APRIL, a proliferation inducing ligand; AUC, area under the curve; CAR, chimeric antigen receptor; BLI, bioluminescent imaging.

