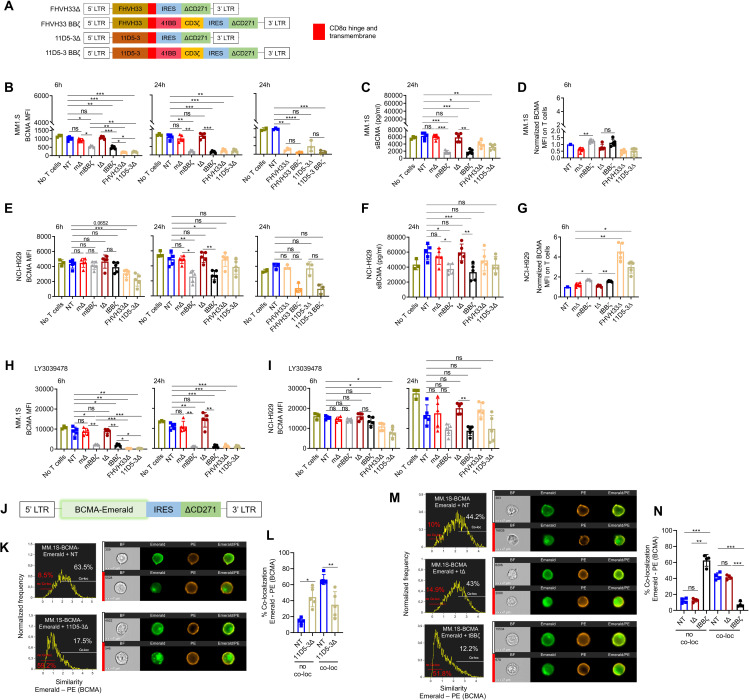
Figure 4.
B cell maturation antigen (BCMA) downmodulation on MM cells by CAR T cell trogocytosis and BCMA internalization. (A) Schemes of FHVH33 and 11D5-3 CAR retroviral vector constructs. (B) BCMA cell surface levels on MM.1S cells co-cultured with CAR T cells (E:T 1:1) at indicated time points. (C) Soluble BCMA (sBCMA) levels in MM.1S co-culture supernatant (24 hours). (D) BCMA levels on CAR T cells co-cultured with MM.1S cells, normalized to NT (6 hours). (E) BCMA cell surface levels on NCI-H929 cells co-cultured with CAR T cells (E:T 1:1) at indicated time points. (F) sBCMA levels in NCI-H929 co-culture supernatant (24 hours). (G) BCMA levels on CAR T cells co-cultured with NCI-H929 cells, normalized to NT (6 hours). (H–I) Cell surface BCMA levels on MM cells co-cultured with CAR T cells (E:T 1:1) at indicated time points, in the presence of γ-secretase inhibitor, 0.1 µM Crenigacestat (LY3039478). n=5, mean±SD, one-way ANOVA with Tukey’s comparison. (J) Scheme of BCMA-Emerald retroviral vector with ΔCD271 as selectable marker. (K–N) MM.1S-BCMA-Emerald cells were co-cultured for 1 hour with NT or 11D5-3Δ CAR T cells (K–L) or with NT, tΔ or tBBζ CAR T cells (M–N). Co-localization of BCMA-Emerald and BCMA cell surface staining (PE) was analyzed by Image Stream. (K, M) Representative images and gating. (L, N) Summary graphs show percentage of no co-localization (no co-loc) or co-localization (co-loc) of BCMA-Emerald and cell surface BCMA (PE) in MM.1S-BCMA-Emerald cells. n=4–5, mean±SD, paired t-test. (B–I, L, N) Definition of significance levels: ns, not significant, *p<0.05, **p<0.01, ***p<0.001, ****p<0.0001. (B, D, E, G, H, I) BCMA cell surface levels were determined by FACS. (C, F) sBCMA levels were determined by ELISA. CAR, chimeric antigen receptor; NT, non-transduced; ANOVA, analysis of variance.

