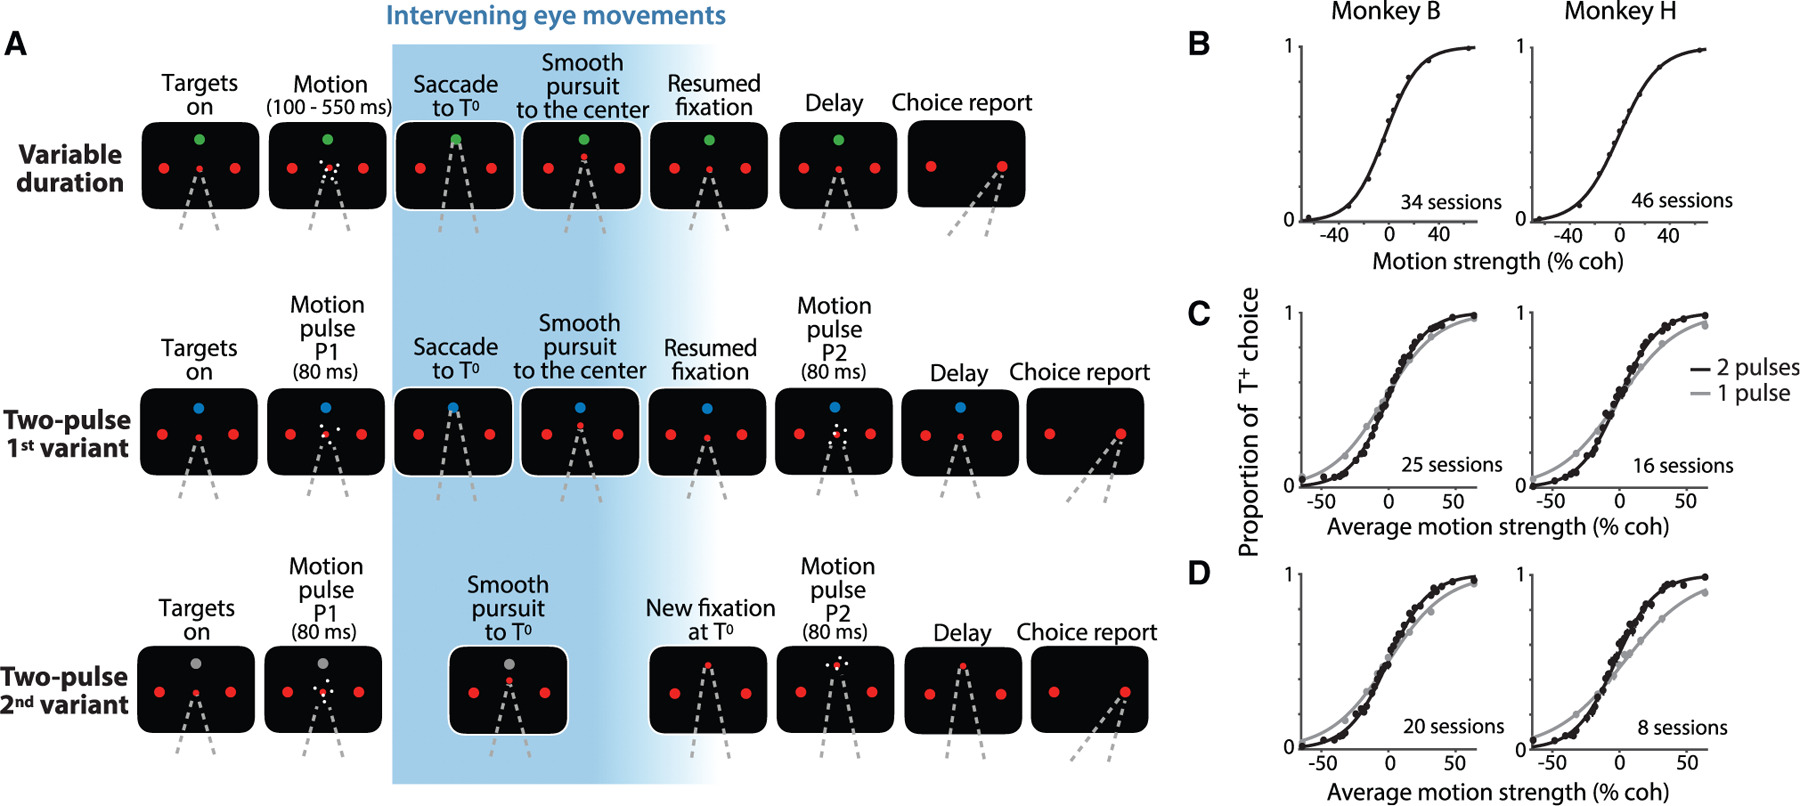
Figure 1. Tasks and behavior.

The monkey decided the net direction of random dot motion (RDM) by making an eye movement to the associated choice target (T+ or T−). The RDM stimulus was displayed at the point of fixation (FP). The choice targets remained visible at fixed positions throughout the trial, but the monkey made intervening eye movements (IEMs; blue gradient) between the initial fixation and the final choice saccade. The first intervening eye movement was always to the choice-neutral target, T0, which was displayed in a different color than the red choice targets.
(A) Sequence of events in the three tasks. In the variable duration task (top), the RDM stimulus was displayed for 100–550 ms. After the post-RDM delay (500 ms), the monkey made a saccade to T0, held fixation there, and made a smooth-pursuit eye movement back to the original FP. After a variable delay, the FP was extinguished, and the monkey reported its choice. In the two-pulse tasks (middle and bottom rows), the monkey reported the common direction of two brief (80 ms) motion pulses displayed before (P1) and after (P2) the IEM. The monkey indicated its decision after a 500 ms delay. In the 1st variant (middle), the monkey executed the same IEM as in the variable duration task, such that the monkey viewed P1 and P2 from the same gaze direction. In the 2nd variant (bottom), the monkey made an intervening smooth-pursuit eye movement to T0 and viewed P2 from this gaze direction. The choice targets remained fixed at the same screen locations throughout the trial and therefore occupied different retinal locations during viewing of P1 and P2.
(B–D) Performance of the two monkeys on the three tasks. Proportions of T+ choices are plotted as a function of motion strength and direction (indicated by sign). Curves are logistic regression fits. Error bars are SE; some are smaller than the data points. In the variable duration task (B), all stimulus durations are combined. See also Figures S1A and S1B. In the two-pulse tasks (C and D), the proportion of T+ choices is plotted as a function of the average strength of the motion in the two pulses. Gray circles and curves represent the data and the fits from catch trials (one third of trials), where the monkey viewed P1 only. See also Figures S1C and S1D.
