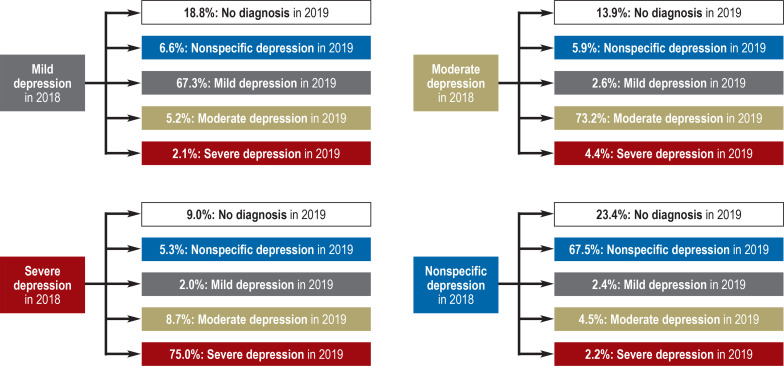
Figure 2.
Changes in diagnosis or severity in a year-on-year comparison between 2018 and 2019
The figure shows the percentages of patients according to disease severity in 2018 and the changes in diagnosis in 2019. Patients were assigned to the highest-coded level of severity in each year. If the same patient was coded with both specific and nonspecific diagnoses, the specific diagnosis was used as a basis for the classification in the year under consideration. The data basis consists of diagnoses in the outpatient medical sector as well as the inpatient care sector. Example interpretation: Of the patients with mild severity in 2018, 18.8% were diagnosed with no depression in 2019. A total of 67.3% of patients were still coded with a mild depressive disorder. Moderate or severe depression was found in 5.2% and 2.1%, respectively, of patients whose severity level was originally mild; 6.6% of patients received only a nonspecific diagnosis in 2019. The percentage of patients that were affected in 2018 but received no diagnosis in 2019 declined with increasing severity.

