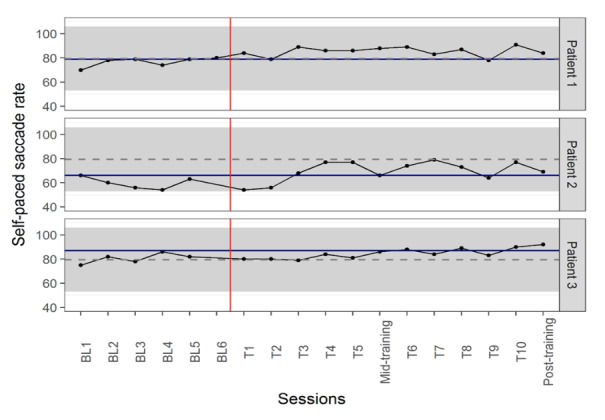
Figure 2:

Self-paced saccade rate changes during baseline and training sessions (The number of self-paced saccades during 30 seconds was counted). Solid blue line represents the highest baseline value for each patient. Grey dashed lines and grey backgrounds show the mean ± standard deviation in healthy non-gamers participants. The red vertical line separates the baseline and training periods. BL = baseline and T= training day.
