Figure 1.
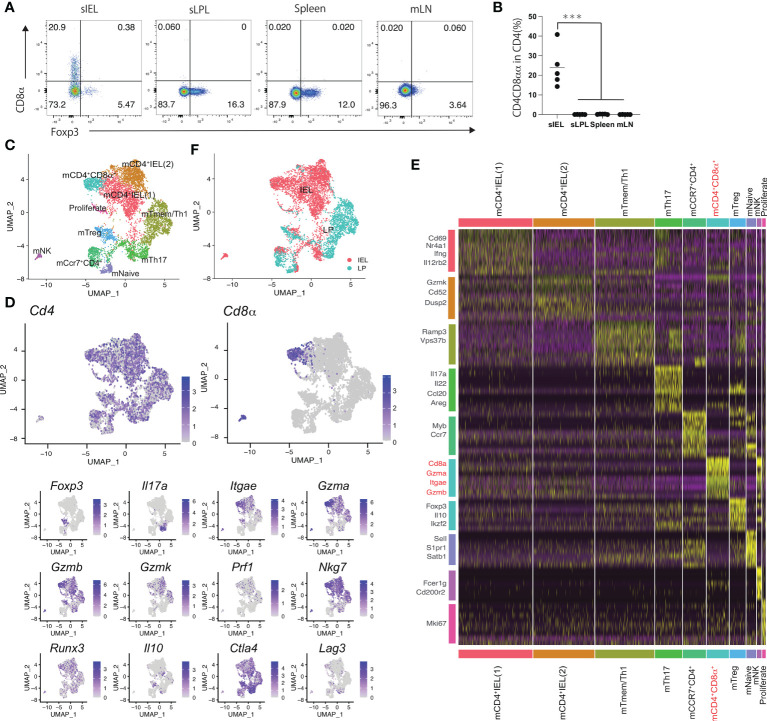
Mouse CD4 cytotoxic T cells expressing CD8a are composed of a single population (A) Eight-week-old C57BL/6J mice received the CE2-diet (Ctrl-diet; n=5/group). Representative flow cytometry plots for Foxp3 expression in CD4 positive lymphocytes in the small intestine intraepithelial lesion (sIEL), lamina propria (sLPL), spleen, and mesenteric lymph node (mLN). (B) Percentage of CD8α+ cells among the CD4+TCRβ+ lymphocyte subset in sIEL, sLPL, spleen, and mLN. (C) Single-cell analysis was performed using CD4+ T cells in IEL and LPL from 11weeks-old WT mouse. All cells were classified into clusters (1–10) and analyzed using uniform manifold approximation and projection (UMAP). (D) Heat map for gene expression, for genes expressed in mCD4-CTLs (Cd4, Cd8α, Gzma, Gzmb, Gzmk, Itgae, Prf1, Nkg7, Runx3) and helper T cells (Foxp3, Il17a, Il10, Ctla4, Lag3). (E) Genes from each cluster (1–10) using data from the single-cell analysis. mCD4+CD8α+ cluster and related genes are highlighted (F) Cells were colored in red (IEL) and blue (LPL). P-values were obtained using the Student’s t-test. ***<0.001. Data are shown as the mean ± SEM (B) or ± SD (C) from individual mice (n = 5 for A) and are representative of two independent experiments.

