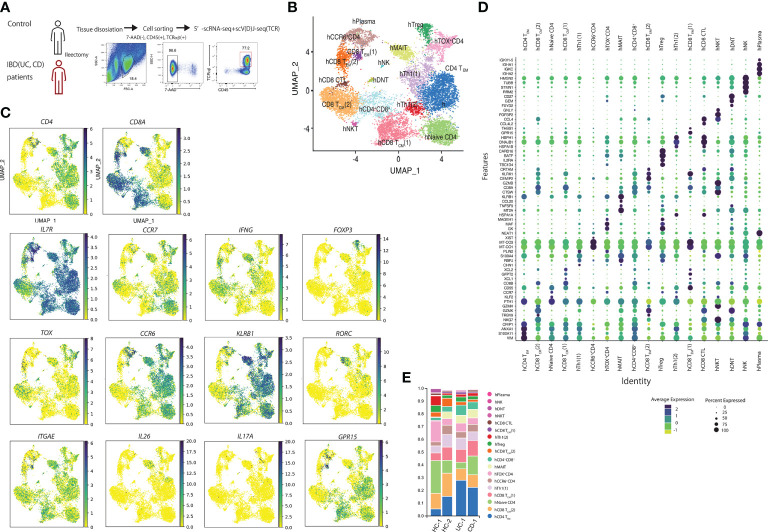
Figure 2.
Human single-cell analysis in controls and patients with inflammatory bowel disease showed that cells are composed of 10 populations. (A) Sorting strategy for the human single-cell RNA-seq data: LPLs collected from digested small intestinal tissues were sorted by identifying 7AAD–CD45+TCRB+ cells by FACS. (B) Uniform manifold approximation and projection (UMAP) embedding of a total of 12,073 cells from controls (n=2) and patients with inflammatory bowel disease (IBD) (n=2) (7012 cells from controls, 531 cells from UC, and 4530 cells from CD patients). Cells were clustered into 18 clusters. (C) Expression of CD4, CD8A, IL7R, CCR7, FOXP3, IFNG, Il17A, TOX, CCR6, KLRB1, RORC, ITGAE, IL26, IL17A and GPR15 in UMAP. (D) featuring genes in human T cell clusters. (E) Proportion of each cluster in controls and patients with IBD.

