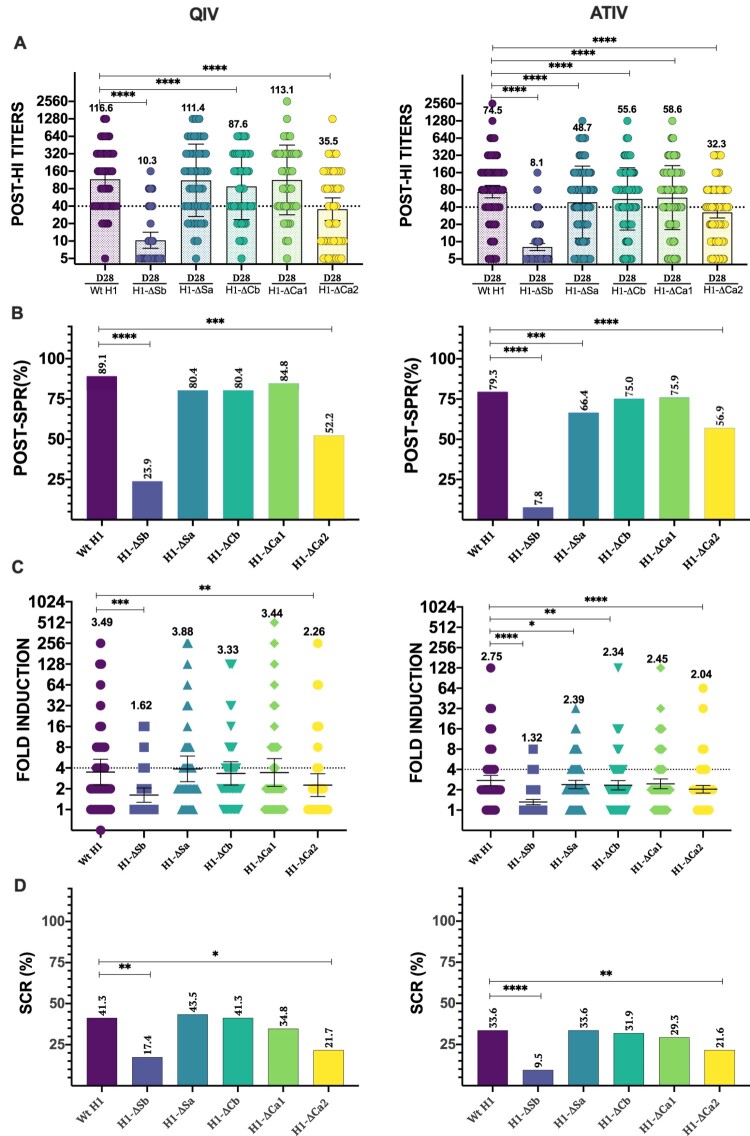
Figure 2.
Response to vaccination. In (A) individual profiles of HAI antibody responses at day 28 against Wt H1 and modified viruses H1-ΔSb, H1-ΔSa, H1-ΔCb and H1-ΔCa1 and H1-ΔCa2 is represented. GMT value is marked in each column. P-values were determined with the repeated measures one-way Bonferroni’s ANOVA for multiple comparisons test with the Geisser–Greenhouse correction; *P < .05, **P < .01, ***P < .001, ****P < .0001. In (B) SPR after vaccination was calculated as the percentage of patients that achieved HAI titres ≥ 1/40 for each virus and compared to the respective Wt H1 for each cohort. The two-tailed P-value was calculated with the McNemar’s test with the continuity correction; *P < .05, **P < .01, ***P < .001, ****P < .0001. In (C) Fold induction of HAI titres or GMT increase (calculated as “GMTpost/GMTpre”) is represented of modified viruses H1-ΔSb, H1-ΔSa, H1-ΔCb and H1-ΔCa1 and H1-ΔCa2 compared to the Wt H1 in each cohort. P-values were determined with the repeated measures one-way Bonferroni’s ANOVA for multiple comparisons test with the Geisser–Greenhouse correction; *P < .05, **P < .01, ***P < .001, ****P < .0001. In (D) SCR was calculated as percentage of patients who reached a four-fold-induction for each virus and compared to its respective Wt H1 for each cohort. The two-tailed P-value was calculated with the McNemar’s test with the continuity correction; *P < .05, **P < .01, ***P < .001, ****P < .0001.

