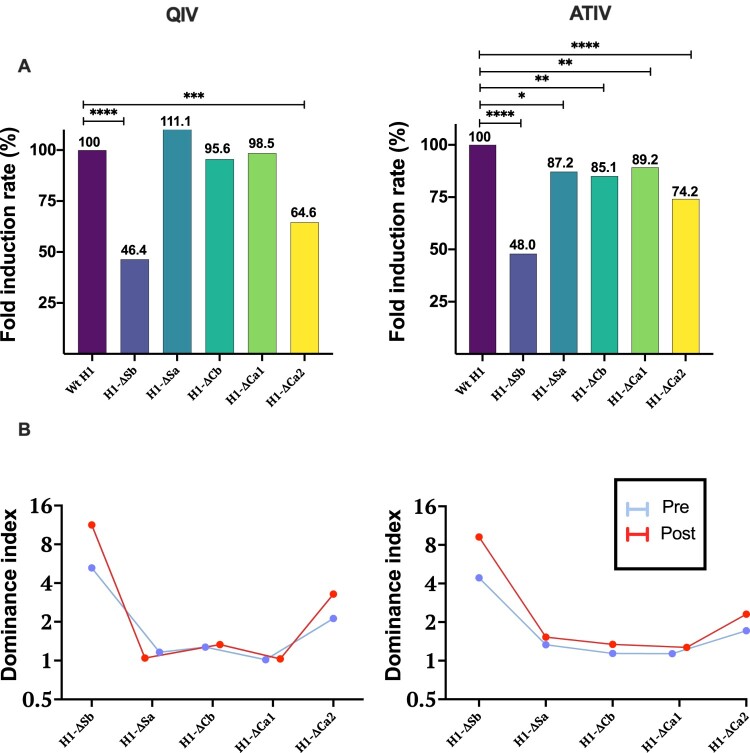
Figure 3.
In (A) Fold Induction Rate ((FI mutant virus/FI Wt H1) × 100) of each virus is represented and compared to the Wt, which is 100%, in both cohorts. P-values were determined with the repeated measures one-way Bonferroni’s ANOVA for multiple comparisons test with the Geisser–Greenhouse correction; *P < .05, **P < .01, ***P < .001, ****P < .0001. In (B) Dominance index of HAI titres before and after vaccination with QIV and ATIV vaccines is represented.

