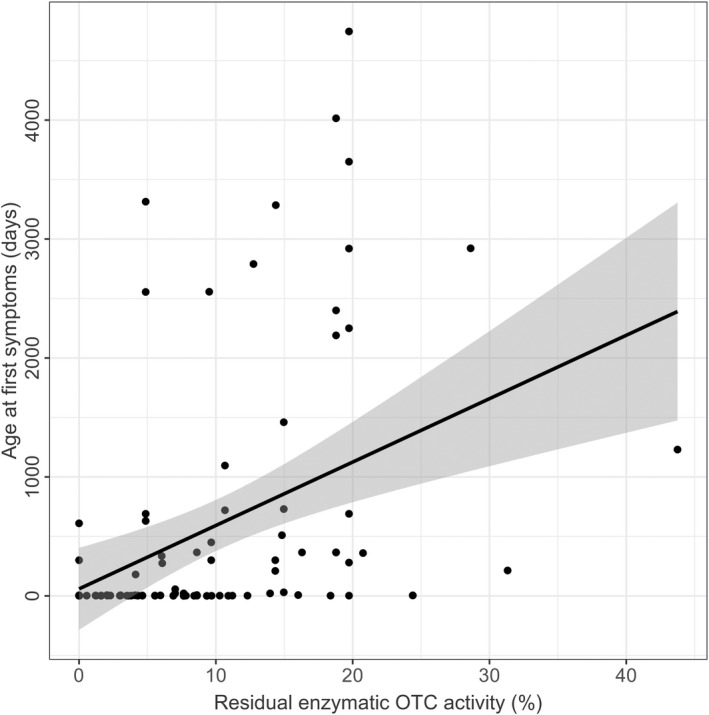
Figure 1.

Residual enzymatic OTC activity predicts age at first symptoms. Age at first symptoms (days) subject to residual enzymatic OTC activity (%). Each point represents a single patient (n = 100). The grey line displays the estimated regression curve. Linear regression, p < 0.0001, R 2 = 0.16.
