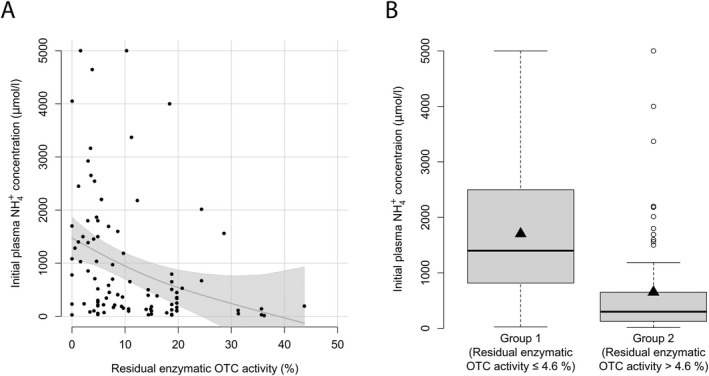
Figure 2.

Residual enzymatic OTC activity correlates with initial plasma NH4 + max. (A) Initial plasma NH4 + max (μmol/L) subject to residual enzymatic OTC activity (%) as determined in the expression system. Each point represents a single patient (n = 98). The grey line displays the estimated regression curve. GAM analysis, p = 0.004, R 2 = 0.102. (B) Box plot illustrating initial NH4 + max (μmol/L) with residual enzymatic OTC activity below or equal to 4.6% (n = 27) and above 4.6% (n = 71). Data are shown as median (black thick line) and mean (triangle), length of the box corresponds to interquartile range (IQR) and upper and lower whiskers correspond to the max. of 1.5 × IQR, each point represents an outlier. Recursive partitioning, p = 0.001.
