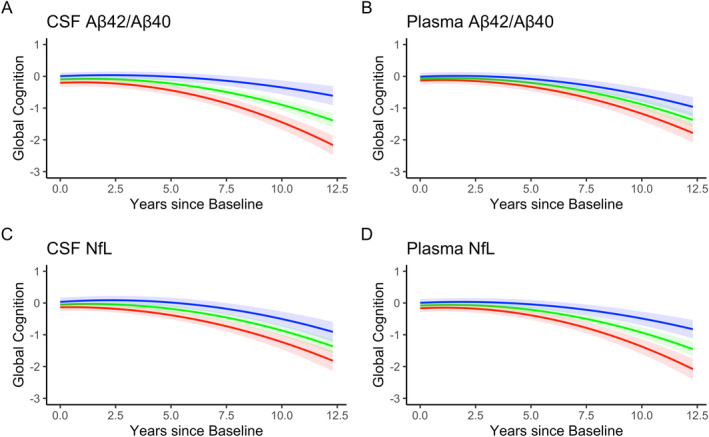
Figure 1.

Associations between each biomarker and global cognitive decline in the complete data set. Trend lines represent “abnormal” (red line, 1 standard deviation below the mean for Aβ42/Aβ40 and one standard deviation above the mean for NfL), “average” (green line, mean value), and “above normal” (blue line, 1 standard deviation above the mean for Aβ42/Aβ40 and one standard deviation below the mean for NfL) for each biomarker. These are descriptive terms for visualization only and do not reflect clinical or pathological cut points. The quadratic rate of change was significant in all models and the biomarkers moderated the quadratic term in all models except for CSF NfL.
