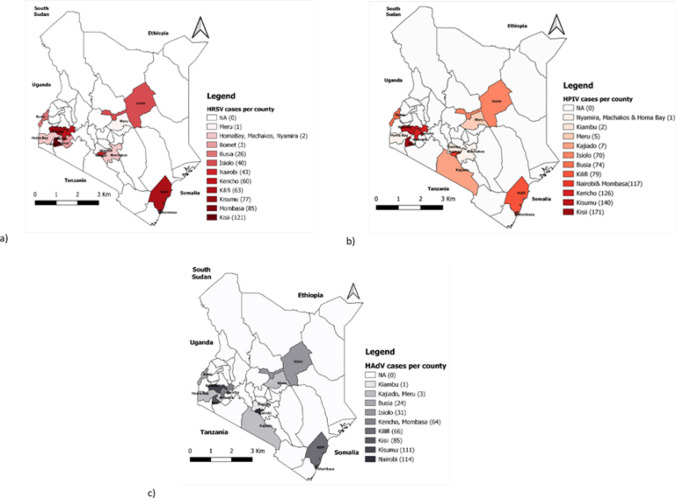
FIGURE 3:
Geographical distribution of (a) Human respiratory syncytial virus (HRSV); (b) Human parainfluenza (HPIV); and (c) Human adenoviruses (HAdV) cases per counties in Kenya (2007-2013)
**NA=not applicable; No cases from these counties were captured at any surveillance site as part of the ILI program.

