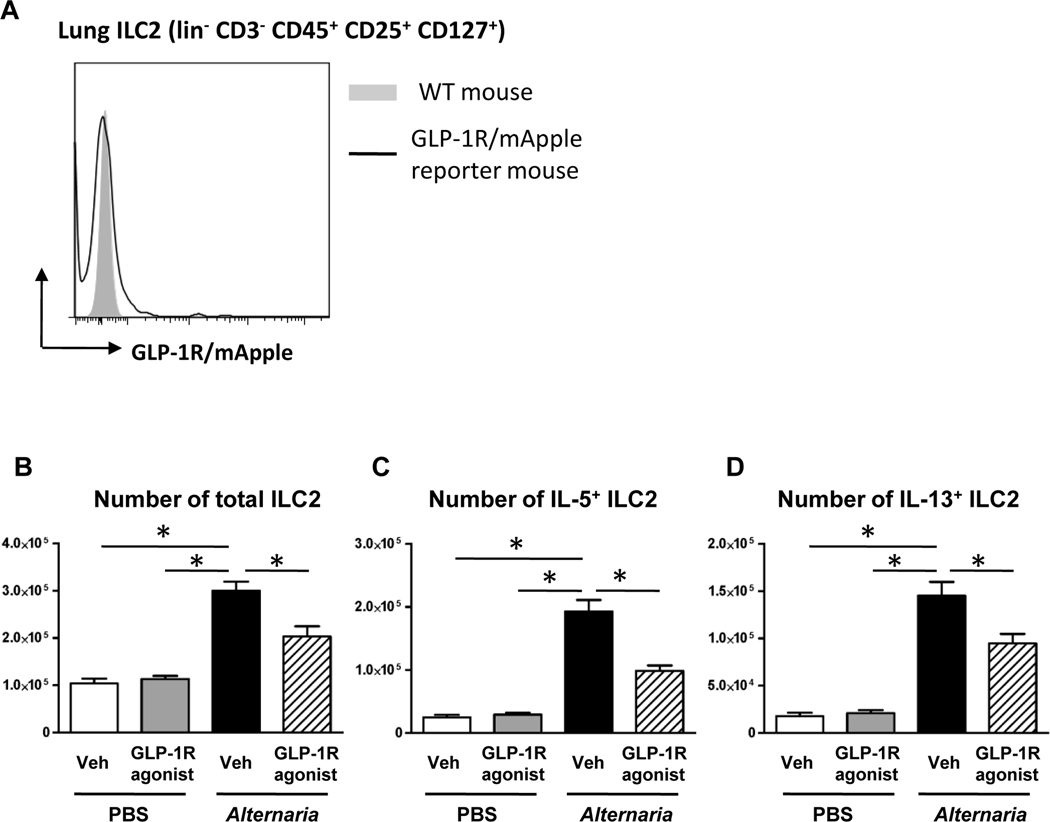
FIG 4.
A, Representative histograms of mApple (GLP-1R) expression on lung ILC2 from WT mice (filled gray area) or GLP-1R/mApple reporter mice (black line). Result is a representative of 3 different mice. B-D, Flow cytometric analysis of the number of total, IL-5+, and IL-13+ ILC2 in the lung. The results are combined with 2 independent experiments, and shown as mean ± S.E.M. of 4 mice in PBS-challenged groups and 8 mice in Alternaria extract-challenged groups. Veh=vehicle. PBS=phosphate buffered saline. * P< 0.05

