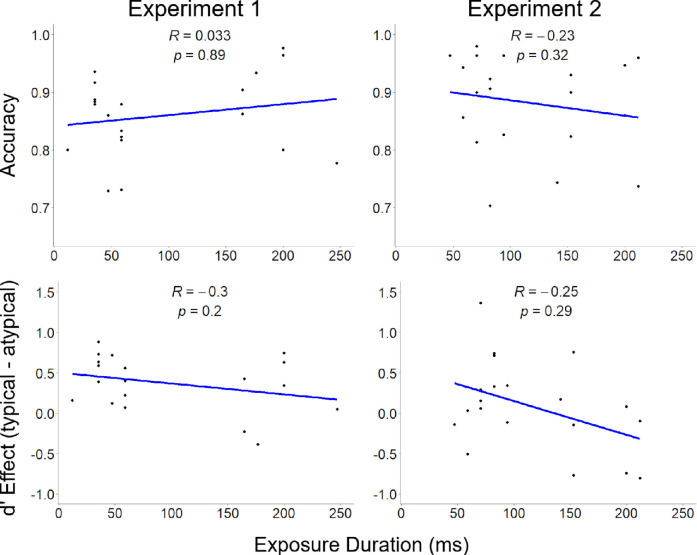
Figure 7.
Relationship between stimulus exposure duration, accuracy (top row), and d-prime (bottom row), for Experiments 1 (left column) and 2 (right column). Spearman's rank correlation and associated p values are depicted at the top center of each facet.

