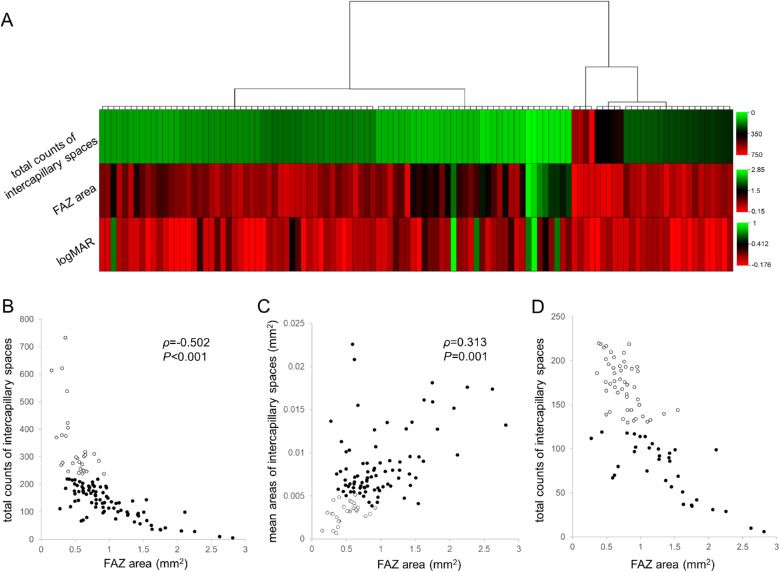
Figure 3.
The clustering using the FAZ area and the total counts of intercapillary spaces discriminates the nonperfusion group from the perfusion group. (A) A heatmap of the agglomerative clustering using Ward's method reveals two major clusters. The characteristics of the left cluster represent the nonperfusion group. (B) These two clusters (white dots = eyes in the right cluster in A; black dots = eyes in the left cluster) are divided by the threshold of the intercapillary spaces (number = 230), but not by the FAZ area, in the scatter plot. (C) The scatter plot shows that no eyes with an enlarged FAZ have small mean areas of the intercapillary spaces. (D) Two minor clusters in the nonperfusion group. White and black dots correspond with left and right subclusters, respectively.

