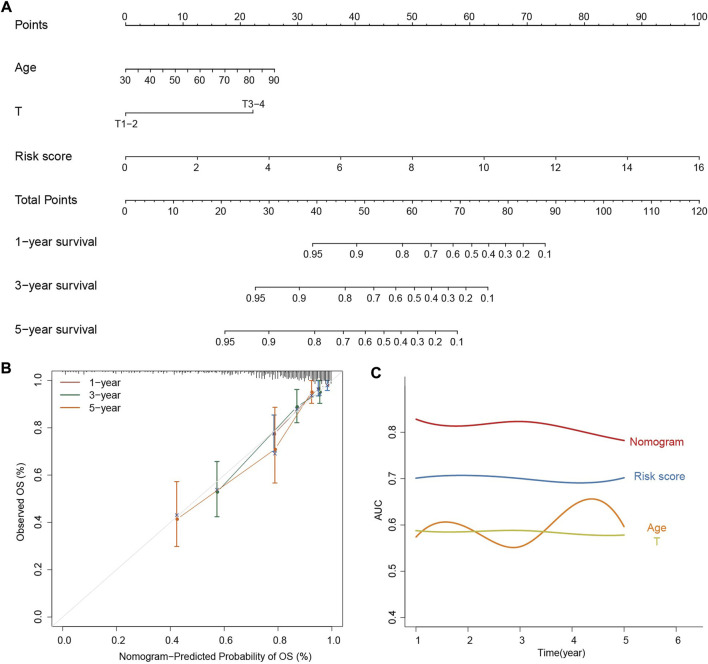
FIGURE 6.
Construction and evaluation of the prognostic nomogram. (A) The nomogram predicts the probability of the 1-, 3-, and 5-year OS. (B) The calibration plot of the nomogram for predicting the probability of the 1-, 3-, and 5-year OS. (C) AUC smooth curve for evaluating the accuracy of nomogram predictions.

