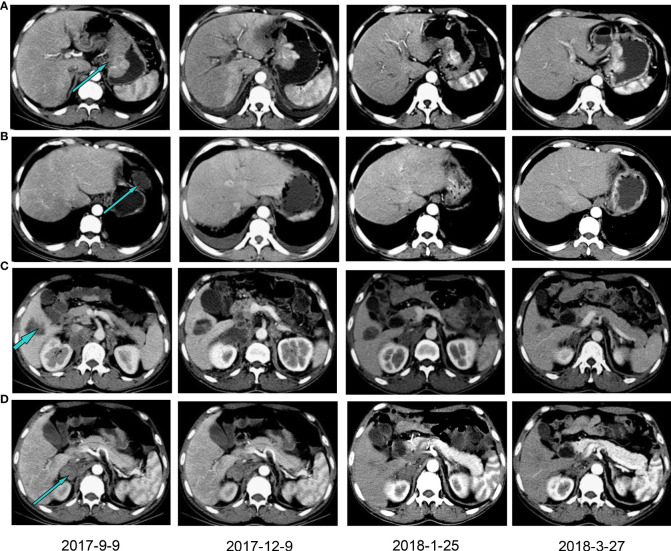
Figure 2.
Computed tomography with contrast showing the patient’s lesions before and after PD-1 inhibitor treatment. The lesions in lesser gastric curvature (A), left front of the gastric body (B), right lobe of the liver (C) and right adrenal (D). Patients were treated with a PD-1 inhibitor from December 2017.

