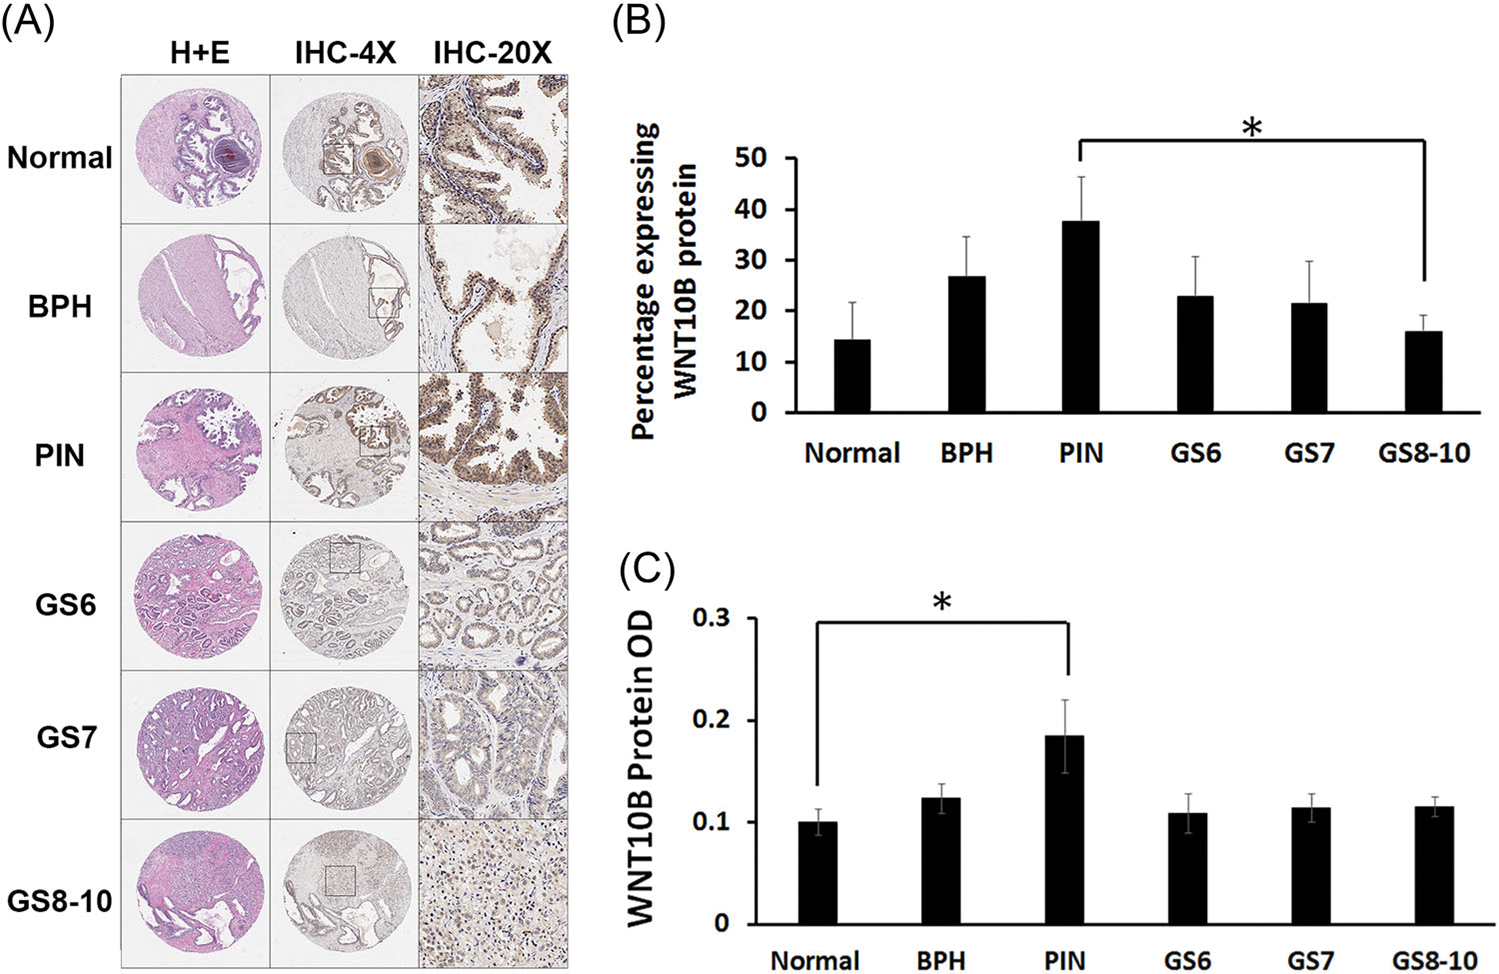
FIGURE 3.

WNT10B protein analysis in human PCa progression TMAs. A, TMAs stained with hematoxylin and eosin stain (first column) and immunostained for WNT10B at ×4 (second column) and ×20 magnification (third column). B, The total percentage of epithelial cells positive for WNT10B increased from normal prostate to BPH and PIN and then progressively decreased from PIN to PCa with increasing GS. *P < .05 between PIN and GS 8 to 10. C, Average intensity of WNT10B protein immunostain was significantly increased from normal prostate to PIN (*P < .05). Signal intensity was reduced with progression to PCa across the increasing GSs. Bars represent the mean ± SEM. N#: normal = 8, BPH = 9, PIN = 9; GS 6 = 8, GS 7 = 9, GS 8 to 10 = 10. BPH, benign prostatic hyperplasia; GS, Gleason score; PCa, prostate cancer; PIN, prostate intraepithelial neoplasia; TMA, tissue microarray
