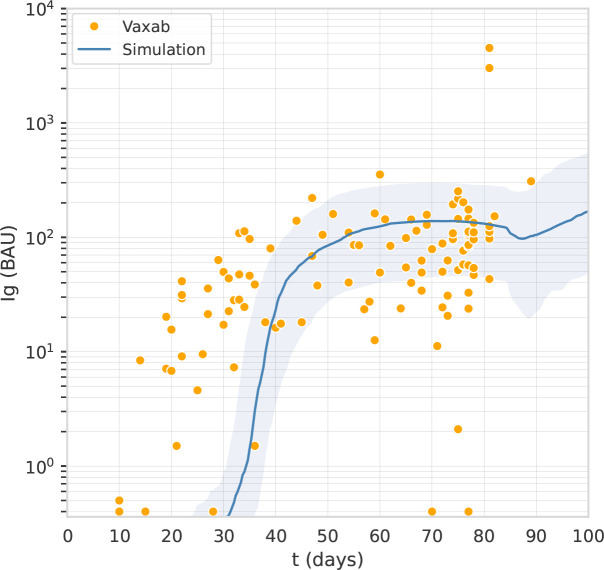
Figure 1.
The computational model captures the antibody titer trajectory, characterized by a plateau. Overlay of a line graph representing in-silico Ig levels after the first dose (the line represents the median, the shading represents the IQR) with a dot plot representing RBD-Spike Ig BAU in individuals who have received one dose of AstraZeneca, in the Vaxab dataset.

