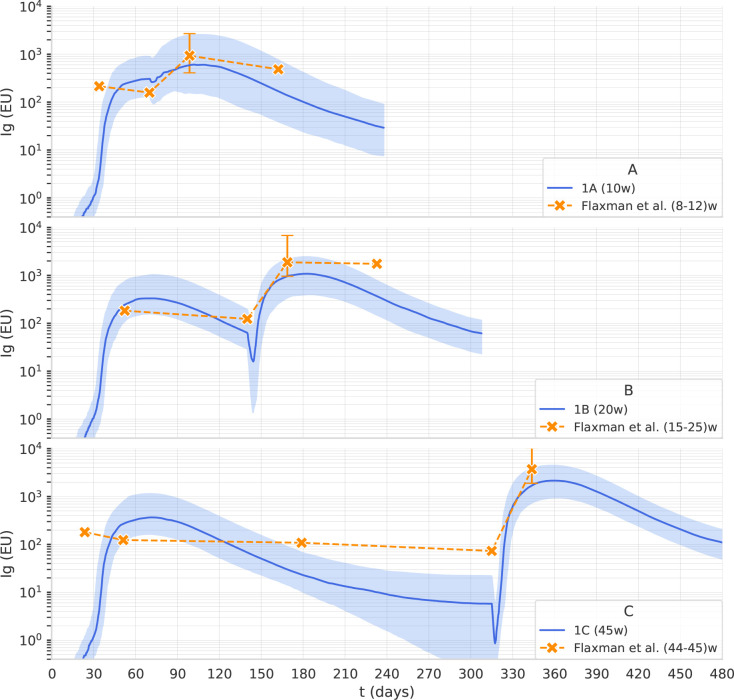
Figure 2.
The computational model reproduces the effect of the dosing interval observed in clinical trials. Overlay of in-silico Ig levels in two-dose protocols 1A, 1B, and 1C (the line represents the median, the shading represents the IQR) with a dotplot representing median anti-Spike Elisa Units in clinical trial data from (11), corresponding to inter-dose periods of 8-12, 15-25 and 44-45 weeks for panel (A–C), respectively.

