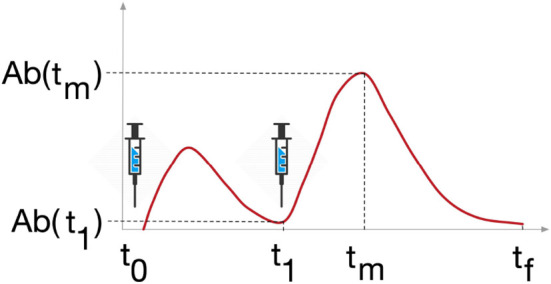
Figure 3.

Study design. Variables Ab, Plb, Th, Tc and B were analyzed at 3 timepoints, t1 is the timepoint before the last dose of vaccine, tm is the timepoint when the variable reaches its maximum after the last dose, and tf is the last timepoint of the simulation, 6 months after the last dose.
