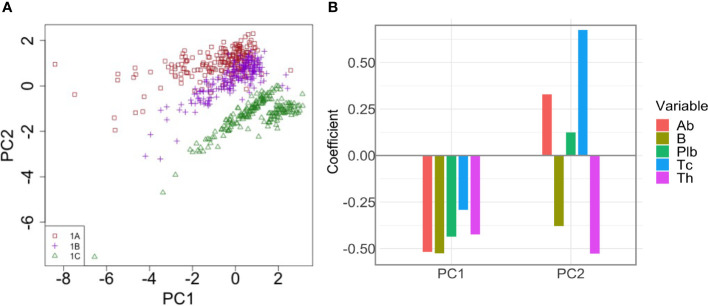
Figure 7.
Principal Component Analysis of the correlation between pre-existing immunological memory at t1 and the peak value of the antibody response to the second dose. (A) The dot plot shows PC1 and PC2 in individuals in treatment groups 1A, 1B and 1C. PC2 separates the different dosing protocols. (B) Loadings of PC1 and PC2. In PC2, Tc has the highest loading.

